Review checks
This page describes the Soda Cloud check page navigation.
After creating and verifying a Cloud-managed data contract, you can review the results of its checks directly in Soda Cloud. The Checks page provides visibility into how each check performed during the most recent verification and over time.

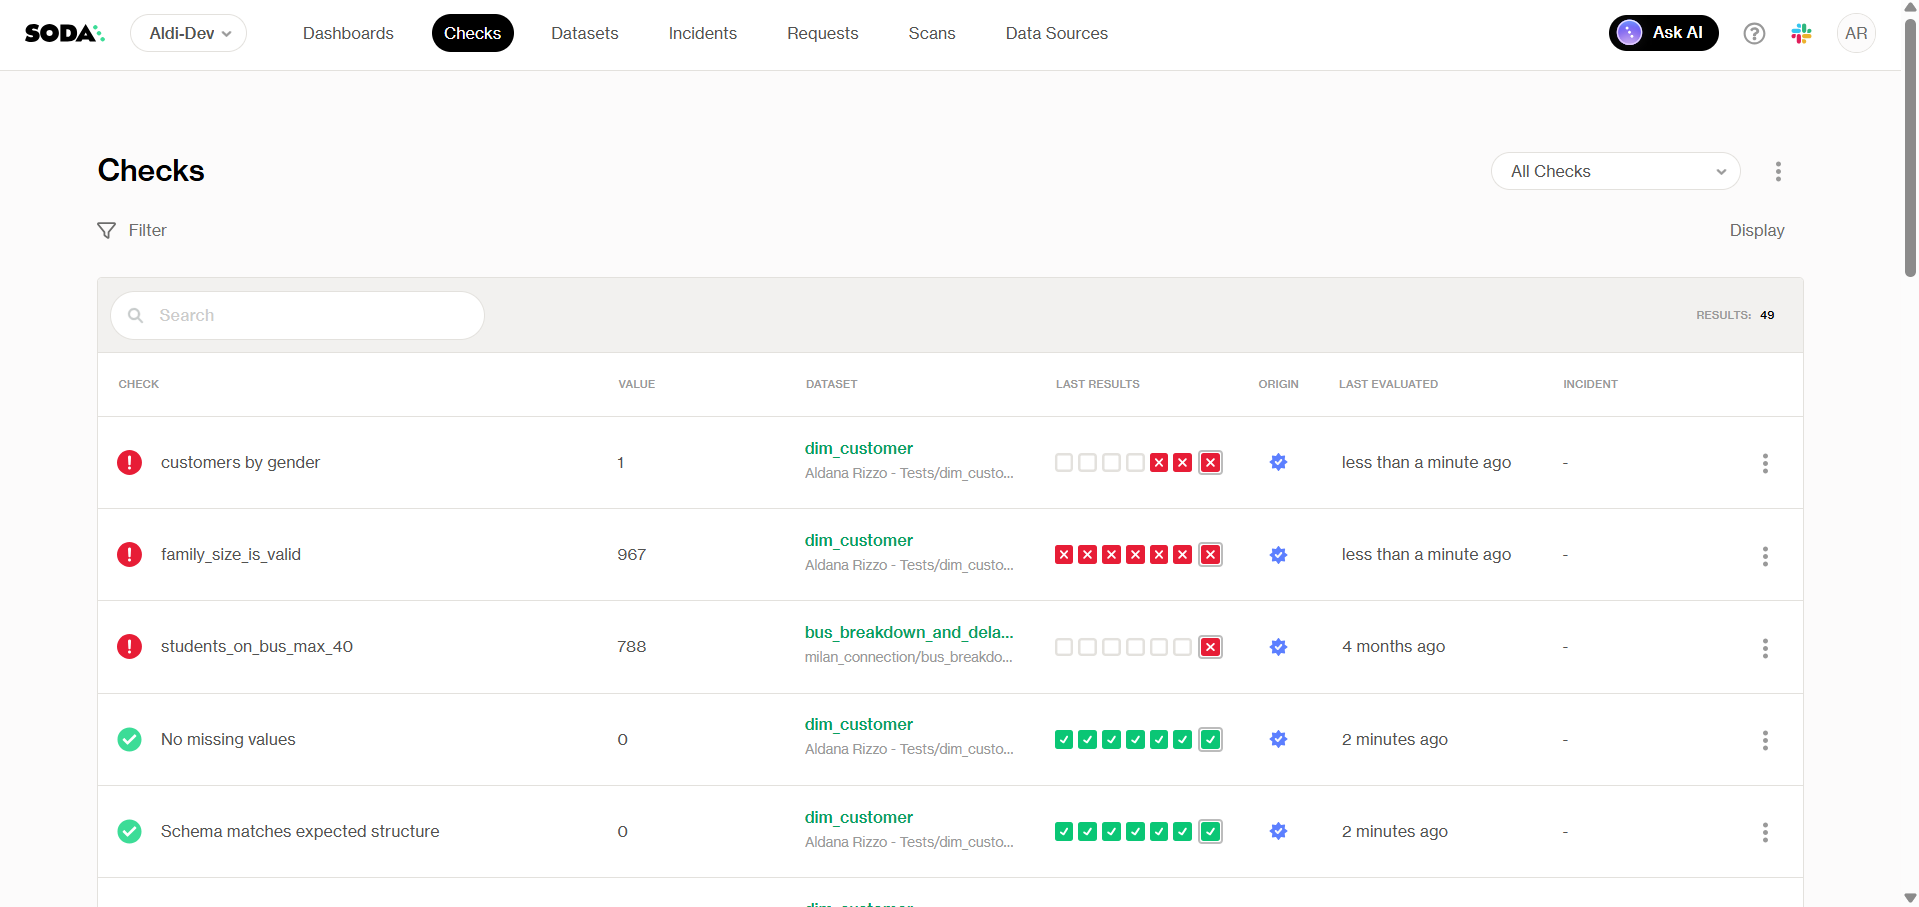
In the Checks page, next to each check, Soda displays the overall verification outcome. The contract can have one of the following states:
Passed: All checks met their defined expectations.
Failed: One or more checks violated the contract.
Error: The contract could not be evaluated due to configuration, connectivity, or runtime issues.
Each individual check is listed with its status. This allows you to quickly identify which rule failed and assess its impact.
Accessing check results
You can access a check page in Soda Cloud in multiple ways:
Navigate to the dataset > Checks tab > Select the check you want to inspect
Navigate to the Checks page (top menu) and search for the check you want to inspect
Understanding individual check results
Selecting a check opens its detailed view. This page includes:
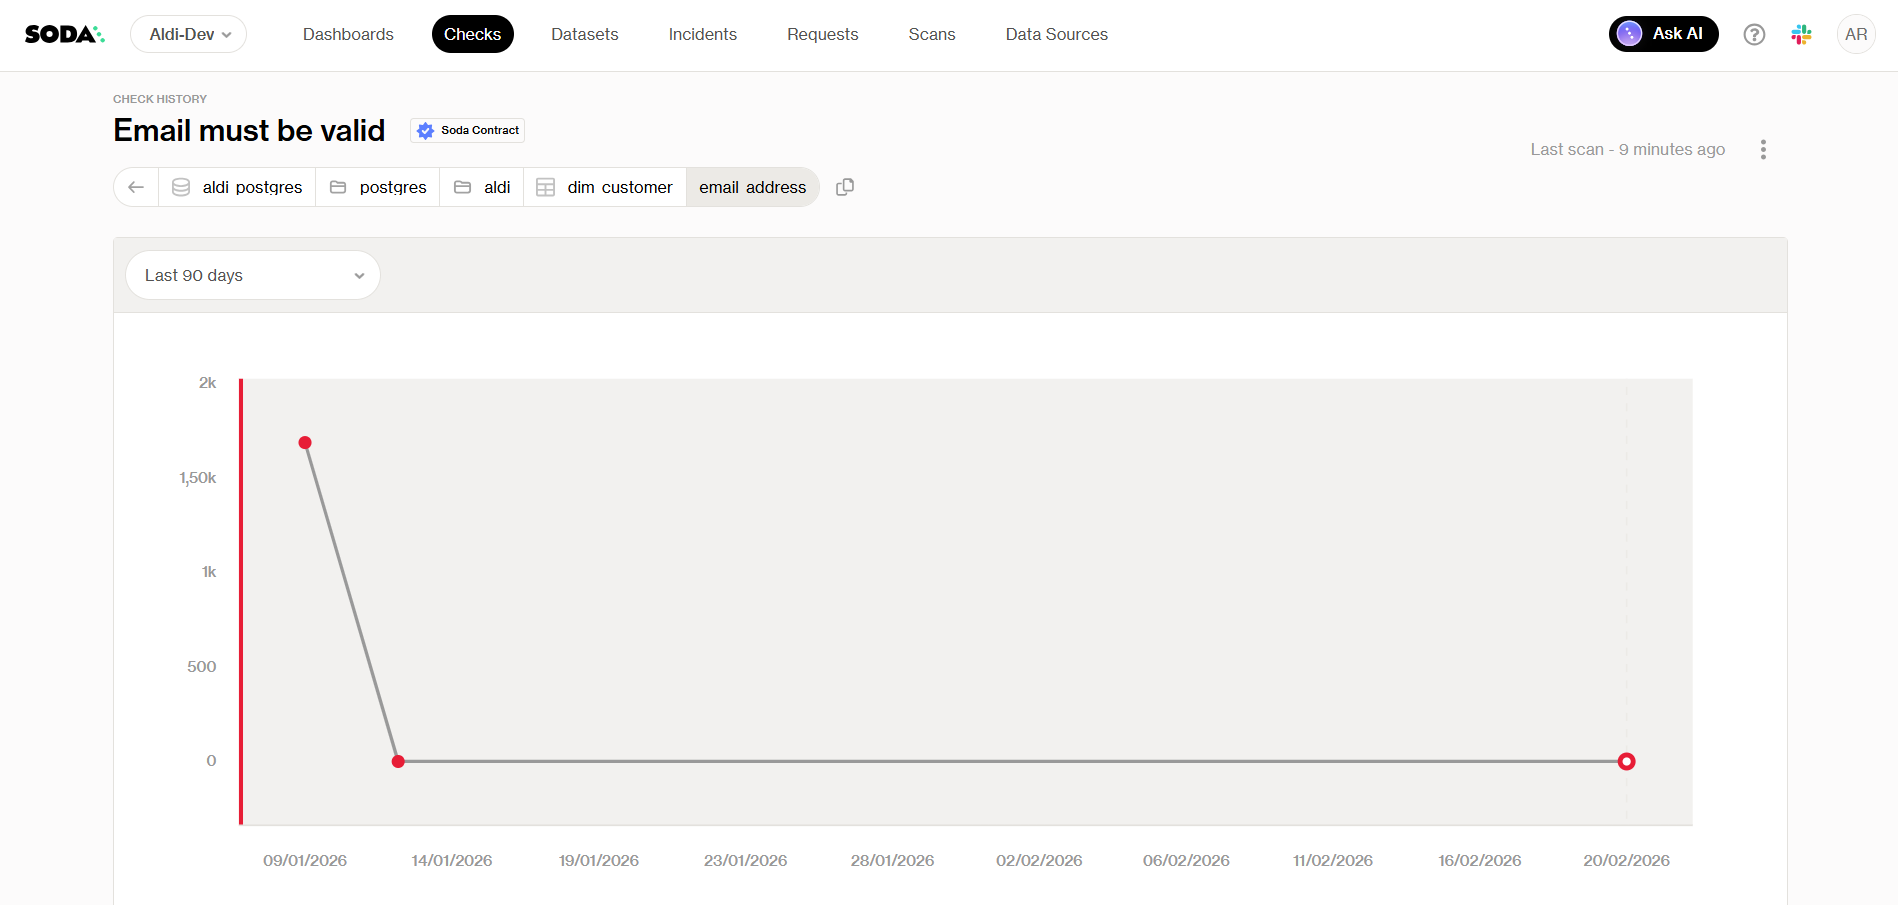
Historical plot
Check results are stored for each verification run. You can review previous runs to understand how a check has behaved over time. This helps identify recurring issues, assess the impact of upstream changes, and validate that fixes have resolved the problem.

Email must be valid check in the dim_customer datasetResult tab
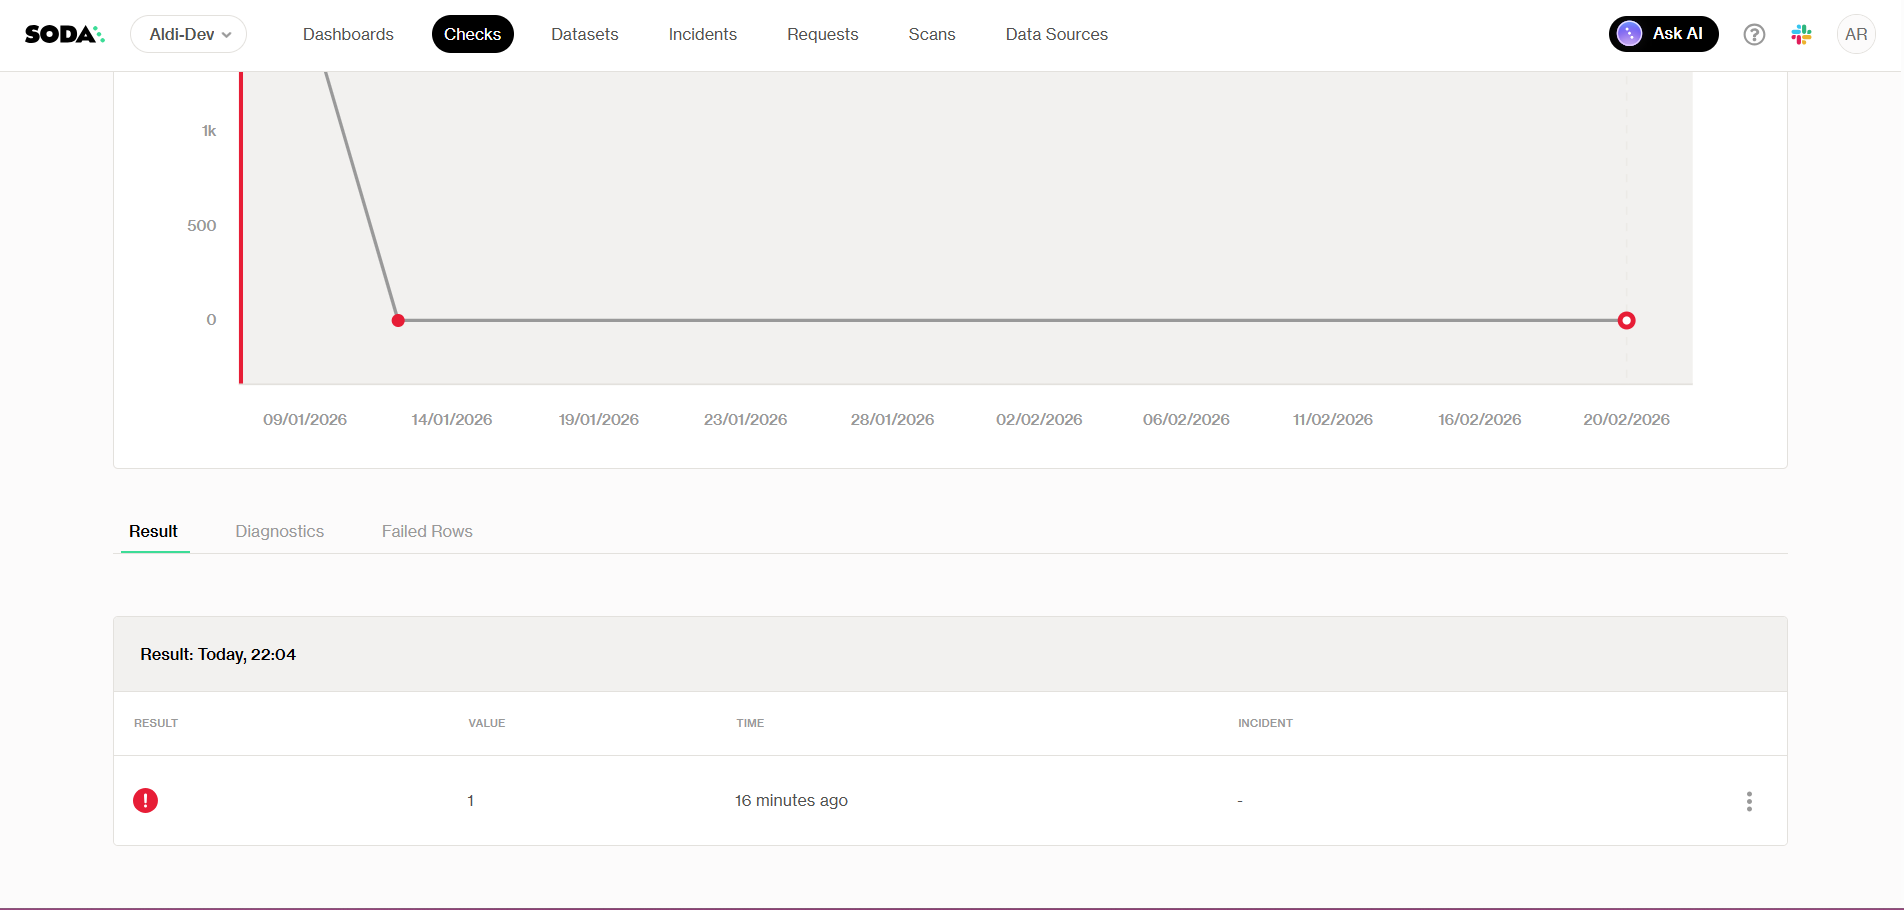
The Result tab provides a concise summary of the outcome of the most recent contract verification for the selected check. It answers the primary question: did this rule pass or fail, and what was the measured value?
At the top of the tab, Soda displays the timestamp of the most recent verification run. Below, a result table summarizes the execution with four fields: the check status, the measured value, the time of execution, and any linked incident.

Diagnostics tab
Each check includes a Diagnostics tab that explains how the result was computed. Diagnostics provides execution metadata that supports transparency and troubleshooting by showing exactly how Soda evaluated the contract condition.
The tab displays a list of diagnostic properties for the most recent run:
Failed rows count
The number of rows that failed the check in this run.
Failed rows percent
The failed rows count expressed as a percentage of Check rows tested. Populated when Check rows tested is available.
Dataset rows tested
The total number of rows in the dataset evaluated during the run.
Check rows tested
The number of rows directly tested by the check. For row-level checks (missing, invalid, duplicate), this is populated automatically. For failed rows query checks, this is only populated when rows_tested_query is configured on the check.

Failed rows tab
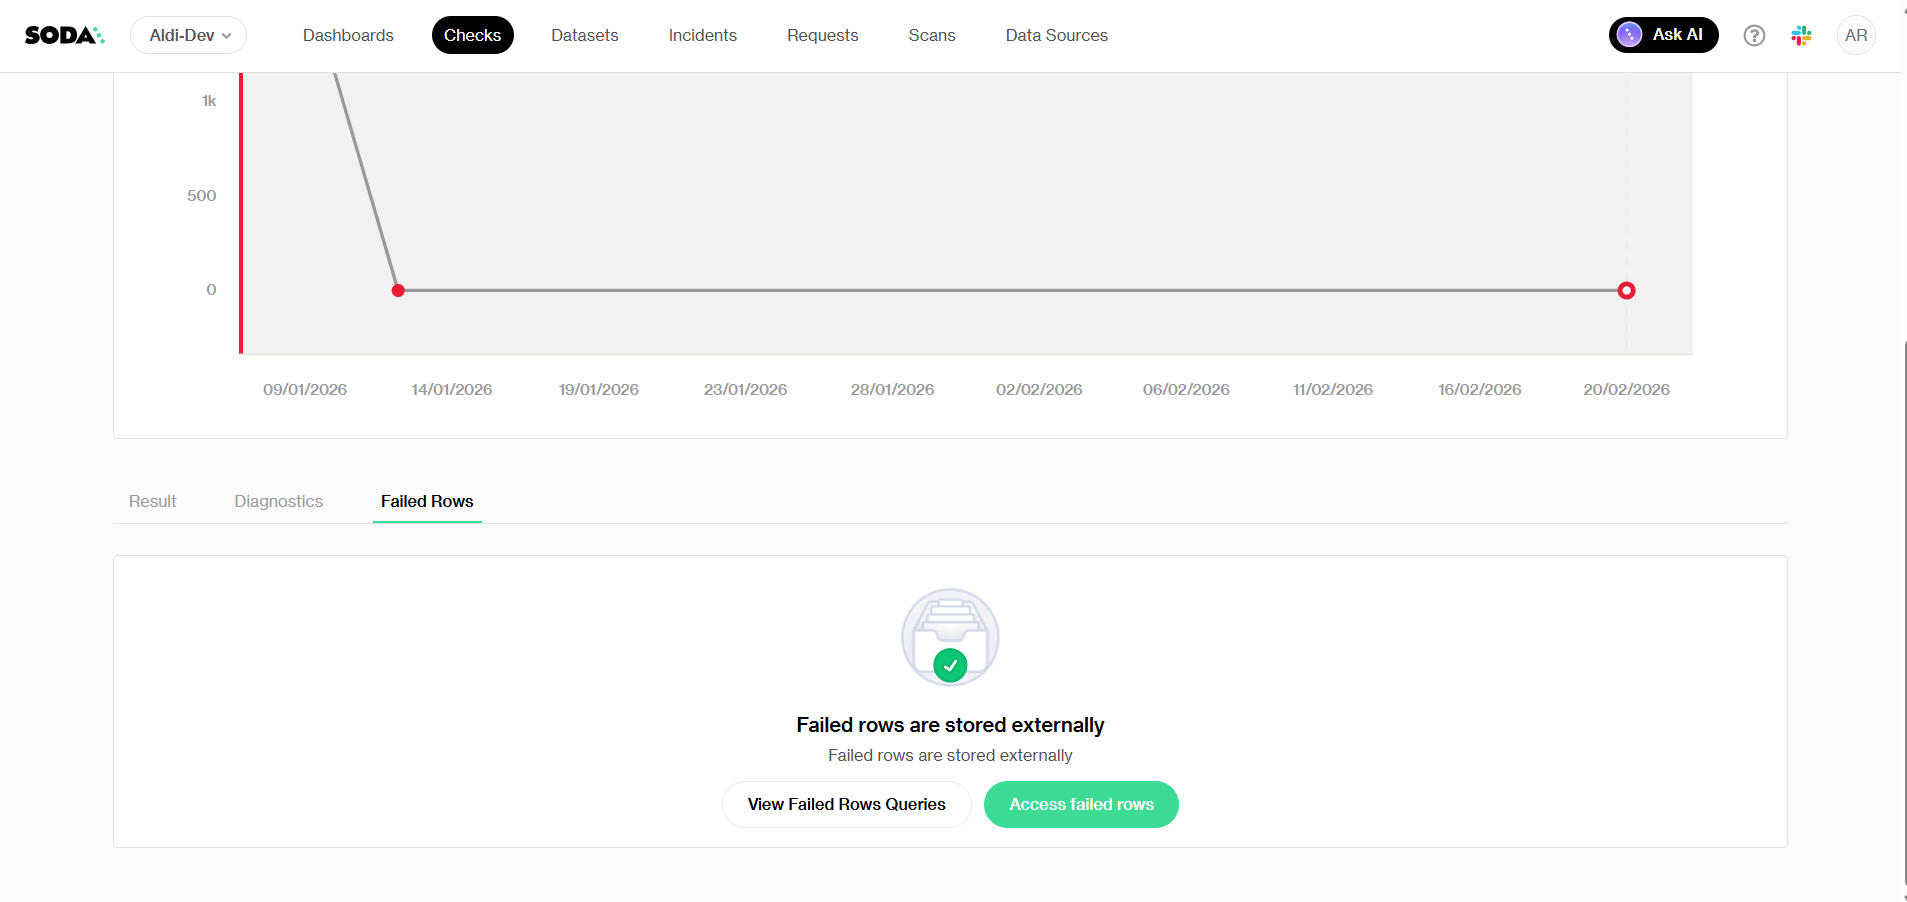
When available, failed rows are stored externally in your own data source to guarantee security and privacy. On this tab, Soda provides failed rows queries and, if configured, direct access your Diagnostics Warehouse to view failed rows.
If Diagnostics Warehouse is enabled, the Failed Rows tab provides access to the specific records that violated the rule. This allows you to:
Inspect the raw data that caused the failure.
Validate business assumptions.
Share concrete examples with data producers.
Accelerate root cause analysis.
When failed row storage is not enabled, this tab remains visible but inactive.

Reviewing checks in Soda Cloud closes the feedback loop between defining expectations and enforcing them. Data contracts establish what “good data” means. Each check page shows whether your data currently meets that standard and provides the information needed to investigate and resolve any violations.
You are not logged in to Soda and are viewing the default public documentation. Learn more about Documentation access & licensing.
If you do have a Soda license, make sure to log in to Soda Cloud in this same browser.
Last updated
Was this helpful?