Anomaly detection checks (deprecated)
Anomaly detection checks use a machine learning algorithm to automatically detect anomalies in your time-series data.
This check is being deprecated. A new version—rebuilt from the ground up, 70% more accurate and significantly faster—was launched at the Databricks AI Summit. 2025. 👉 Try it now!
Use an anomaly detection check to automatically discover anomalies in your check metrics.
# Basic example for row count
checks for dim_customer:
- anomaly detection for row_count# Advanced example with optional training and model configurations
checks for dim_customer:
- anomaly detection for row_count:
name: "Anomaly detection for row_count" # optional
identity: "anomaly-detection-row-count" # optional
severity_level_parameters: # optional
warning_ratio: 0.1
min_confidence_interval_ratio: 0.001
training_dataset_parameters: # optional
frequency: auto
window_length: 1000
aggregation_function: last
auto_exclude_anomalies: True
alert_directionality: "upper_and_lower_bounds" # optional
model: # optional
hyperparameters:
static:
profile:
custom_hyperparameters:
changepoint_prior_scale: 0.05
seasonality_prior_scale: 10
seasonality_mode: additive
interval_width: 0.999
changepoint_range: 0.8
dynamic:
objective_metric: ["mape", "rmse"]
parallelize_cross_validation: True
cross_validation_folds: 2
parameter_grid:
changepoint_prior_scale: [0.001]
seasonality_prior_scale: [0.01, 0.1]
seasonality_mode: ['additive', 'multiplicative']
changepoint_range: [0.8]
interval_width: [0.999]✔️ Requires Soda Core Scientific (included in a Soda Agent) ✖️ Supported in Soda Core ✔️ Supported in Soda Library 1.2.2 or greater + Soda Cloud ✔️ Supported in Soda Cloud Agreements+ Soda Agent ✖️ Available as a no-code check
About anomaly detection checks
The anomaly detection check is powered by a machine learning algorithm that works with measured values for a metric that occur over time. Soda leverages the Facebook Prophet algorithm to learn patterns in your data so it can identify and flag anomalies. As a relatively easy algorithm to use and tune, Facebook Prophet is ideally suited to both analyzing metrics and giving you control over optional configurations.
As this check tracks and analyzes metrics over time, the algorithm it uses learns from historical patterns in your data, including trends and seasonal variations in the measurements it collects. After learning the normal behavior of your data, the check becomes capable of detecting variations from the norm which it flags as anomalies.
Once flagged, Soda can alert you to the anomaly so that you can take action to correct any issues with your data. Alternatively, you can add a notation to an anomalous measurement to indicate that the anomaly is something you expected to see, such as a spike in order volumes during an aggressive marketing campaign, so that the check knows to discount the measurement as an anomaly.
Importantly, you can fine tune an anomaly detection check to customize some of the algorithm's parameters and improve the check's ability to recognize truly anomalous behavior in your data.
Install Soda Scientific
To use an anomaly detection check, you must install Soda Scientific in the same directory or virtual environment in which you installed Soda Library. Best practice recommends installing Soda Library and Soda Scientific in a virtual environment to avoid library conflicts, but you can Install Soda Scientific locally if you prefer.
Soda Scientific is included in Soda Agent deployment.
Set up a virtual environment, and install Soda Library in your new virtual environment.
Use the following command to install Soda Scientific.
List of Soda Scientific dependencies
pandas<2.0.0
wheel
pydantic>=1.8.1,<2.0.0
scipy>=1.8.0
numpy>=1.23.3, <2.0.0
inflection==0.5.1
httpx>=0.18.1,<2.0.0
PyYAML>=5.4.1,<7.0.0
cython>=0.22
prophet>=1.1.0,<2.0.0
Refer to Troubleshoot Soda Scientific installation for help with issues during installation.
Define an anomaly detection check
The following basic examples demonstrate how to use the anomaly detection with a few metrics. You can use any numeric, freshness, user-defined, missing, or validity metrics with an anomaly detection check.
The first example simply detects anomalies in row_count measurements for the dataset over time, while the second identifies anomalies in the calculated average of values in the order_price column.
The third example gauges anomalies in timeliness of the data in the dataset based on the value of the start_date column.
The following example includes two user-defined metrics: the first uses a SQL query to define the metric, the second uses CTE to do so.
The following examples demonstrate how to define a check that detects anomalies in the number of missing values in the id column relative to historical volumes; the second example detects anomalies in the volume of incorrectly formatted email addresses.
Anomaly detection check results
Because the anomaly detection check requires at least four measurements before it can start detecting what counts as an anomalous measurement, your first few scans yield a [NOT EVALUATED] check result that indicates that Soda does not have enough historical data to be able to detect an anomaly.
Though your first instinct may be to run several scans in a row to produce the four measurements that the anomaly detection needs, the measurements don’t count if the frequency of occurrence is too random, or rather, the measurements don't represent enough of a stable frequency.
If, for example, you attempt to run eight back-to-back scans in five minutes, the anomaly detection does not register the measurements resulting from those scans as a reliable pattern against which to evaluate an anomaly.
Consider using the Soda library to set up a programmatic scan that produces a check result for an anomaly detection check on a regular schedule.
Migrate to anomaly detection
If you have an existing anomaly score check, you can migrate to use an anomaly detection check. To migrate to the new check, you have three options.
Default The first option is to create a new anomaly detection check to replace an existing anomaly score check. This is the easiest path and the default behavior, but you lose all the historic check results for the anomaly score check and any feedback that you applied to the anomaly score check's measurements. This means that the algorithm starts from scratch to learn patterns in your data that eventually enable it to identify anomalous measurements.
To follow this path, revise your existing anomaly score check to use the anomaly detection syntax, as in the following example.
Recommended The second option is to create a new anomaly detection check and port the historic anomaly score check results and feedback to the new check. This path retains the anomaly score's historic check results and feedback to preserve the algorithm's memory of patterns in your data, though you cannot directly access the retained information via Soda Cloud.
To follow this path, revise your existing anomaly score check to use the anomaly detection syntax, and add the take-over... parameter.
The third option is to keep the existing anomaly score check as is, and create an anomaly detection check in a separate checks YAML file, essentially running two checks in parallel. This path retains the existing anomaly score's historic check results and feedback which you can continue to access directly in Soda Cloud. At the same time, the anomaly detection check begins learning the patterns in your data and accruing separate feedback you add to help it identify anomalous measurements.
To follow this path, create a new checks YAML file, then add an anomaly detection check to the file. Be sure to include both file names in any Soda scan you run programmatically or via the Soda Library CLI, as in the following example command.
Reset anomaly history
If you wish, you can reset an anomaly detection's history, effectively recalibrating what Soda considers anomalous on a dataset.
In Soda Cloud, navigate to the Check History page of the anomaly check you wish to reset.
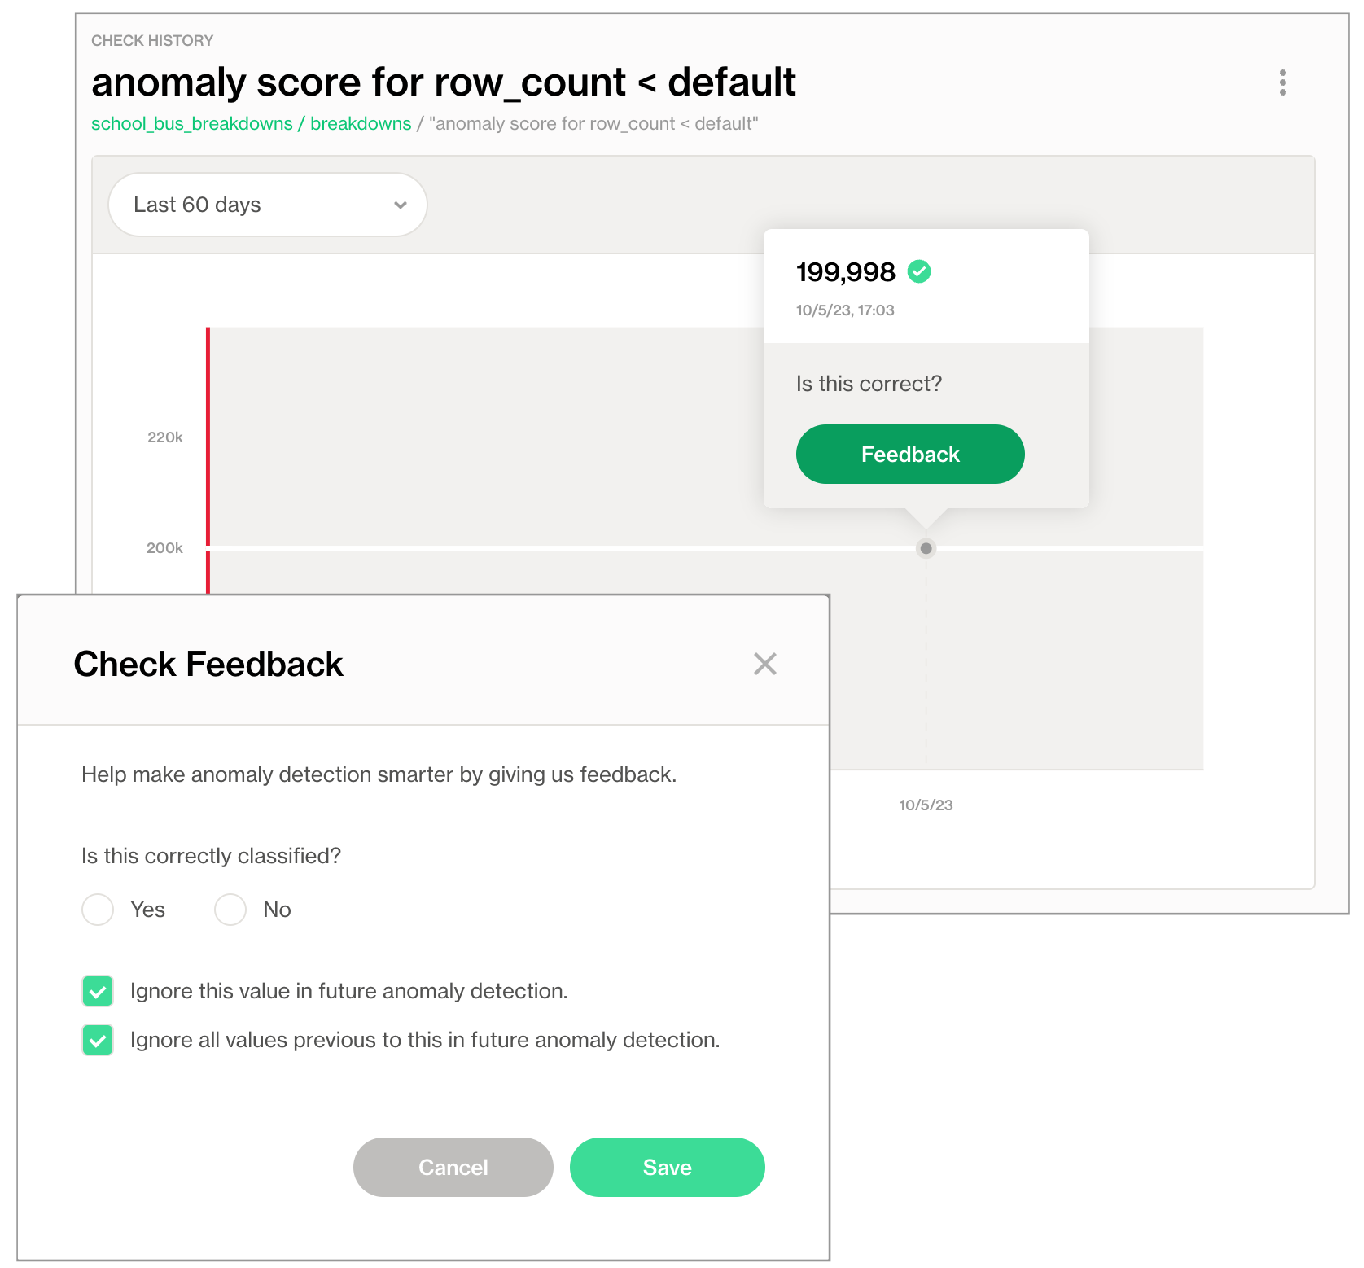
Click to select a node in the graph that represents a measurement, then click Feedback.
In the modal that appears, you can choose to exclude the individual measurement, or all previous data up to that measurement, the latter of which resets the anomaly detection's history.
Optional check configurations
Define alert configurations to specify warn and fail thresholds. See alternative: Manage alert security levels
-
✓
Apply an in-check filter to return results for a specific portion of the data in your dataset.
✓
Use quotes when identifying dataset names; see example. Note that the type of quotes you use must match that which your data source uses. For example, BigQuery uses a backtick (`) as a quotation mark.
Use wildcard characters ( % or * ) in values in the check.
-
✓
Use for each to apply anomaly detection checks to multiple datasets in one scan; see example.
Example with quotes
Example with for each
Manage alert severity levels
You can add optional severity_level_parameters to an anomaly detection check to customize the way that Soda determines the severity level of an anomaly. The following example includes two optional severity level parameters.
warning_ratio
decimal between 0 and 1
0.1
min_confidence_interval_ratio
decimal between 0 and 1
0.001
The warning_ratio parameter determines the area of warning range, which is a buffer on top of the confidence interval. The aim is to help the anomaly detectio ncheck distinguish between warning and critical alerts. If the check result is within the warning range, Soda flags the check result as a warning. This behavior is similar to setting fail and warn conditions in other Soda checks.
Soda calculates the warning range using the following formula:
For example, if the model's confidence interval is [10, 20] and the warning_ratio is 0.1, the upper warning range is ]20, 22] and the lower warning range is [9, 10[. If the check result is within the warning ranges, Soda flags the check result as a warning. If you need wider warning ranges to decrease the amount of critical alerts, you can gradually increase the warning_ratio value to achieve your ideal range.
The graph below illustrates how Soda computes the warning range. The yellow area represents the warning range which is 10% of the confidence interval, as shown with blue and red arrows.

The min_confidence_interval_ratio parameter determines the minimum width of the confidence interval. The confidence interval is the range of values that the model predicts for the next measurement. If the prediction problem is too easy for the model, the confidence interval becomes too narrow and the model becomes too sensitive to small noises in the data.
In such cases, the model may flag normal measurements as anomalies due to small decimal differences. To avoid these scenarios, Soda uses a minimum confidence interval width parameter to handle very narrow confidence intervals. The formula that updates the confidence interval is as follows:
To increase the minimum confidence interval width, you can gradually increase the min_confidence_interval_ratio value until you reach your ideal minimum confidence interval.
The graph below illustrates the impact of the min_confidence_interval_ratio parameter. For this example, the min_confidence_interval_ratio is set to 0 and the measurements are very easy to predict. With such a low setting, the confidence interval is very narrow and insignificant noises produce many falsely-identified anomalies.

To artificially introduce a minimum confidence interval buffer to prevent falsely-identified anomalies, this example sets the min_confidence_interval_ratio to the default value of 0.001. The result is a wider confidence interval that is far less sensitive to small noises in the data.

Add optional training dataset configurations
A training dataset is one that Soda uses to teach the algorithm to identify patterns in the measurements the check collects. To enhance the flexibility of anomaly detection, you can add an optional training_dataset_parameters configuration to your anomaly detection check to customize the way that the check uses the training dataset. You can apply training dataset configurations to the training dataset, time-series prediction model, and/or the anomaly detection check itself.
The following example includes three optional, customizable training dataset parameters.
frequency
auto: automatically detected by Soda
T or min: by minute
H: by hour
D: by calendar day
B: by business day
W: by week
M: by month end
MS: by month start
Q: by quarter end
QS: by quarter start
A: by year end
AS: by year start
customized, such as 5H for every 5 hours
auto
window_length
integer, number of historical measurements
1000
aggregation_function
last: uses the last non-null value in the window
first: uses the first non-null value in the window
mean: calculates the average of values in the window
min: uses the minimum value in the window
max: uses the maximum value in the window
last
auto_exclude_anomalies
boolean, True or False
False as Soda automatically includes anomalies the training dataset unless you add this parameter and set it to true.
The frequency parameter determines the regularity of each measurement in the training dataset. If Soda cannot detect a clear frequency, it assumes a frequency of once-daily, and uses the last measurement for each day, if there is more than one measurement per day.
The window_length parameter sets the number of historical measurements that Soda uses for training the model. The default value is 1000. For instance, if your frequency is daily D, the model trains on the last 1000 days of available historical data to recognize anomalies, ignoring earlier measurements. Be aware that a small value for this parameter may result in less sensitivity to seasonality that Soda recognizes in your data.
When Soda collects more measurements than the automatically-detected or specified frequency, the aggregation_function parameter defines how Soda aggregates the data within each window. For example, if your frequency is hourly and your aggregation function is last and Soda collected two measurements for the same hour, Soda uses the most recent, or latest, measurement for that hour to gauge anomalies.
See the example below for a demonstration of how Soda aggregates the training data using the configurations.

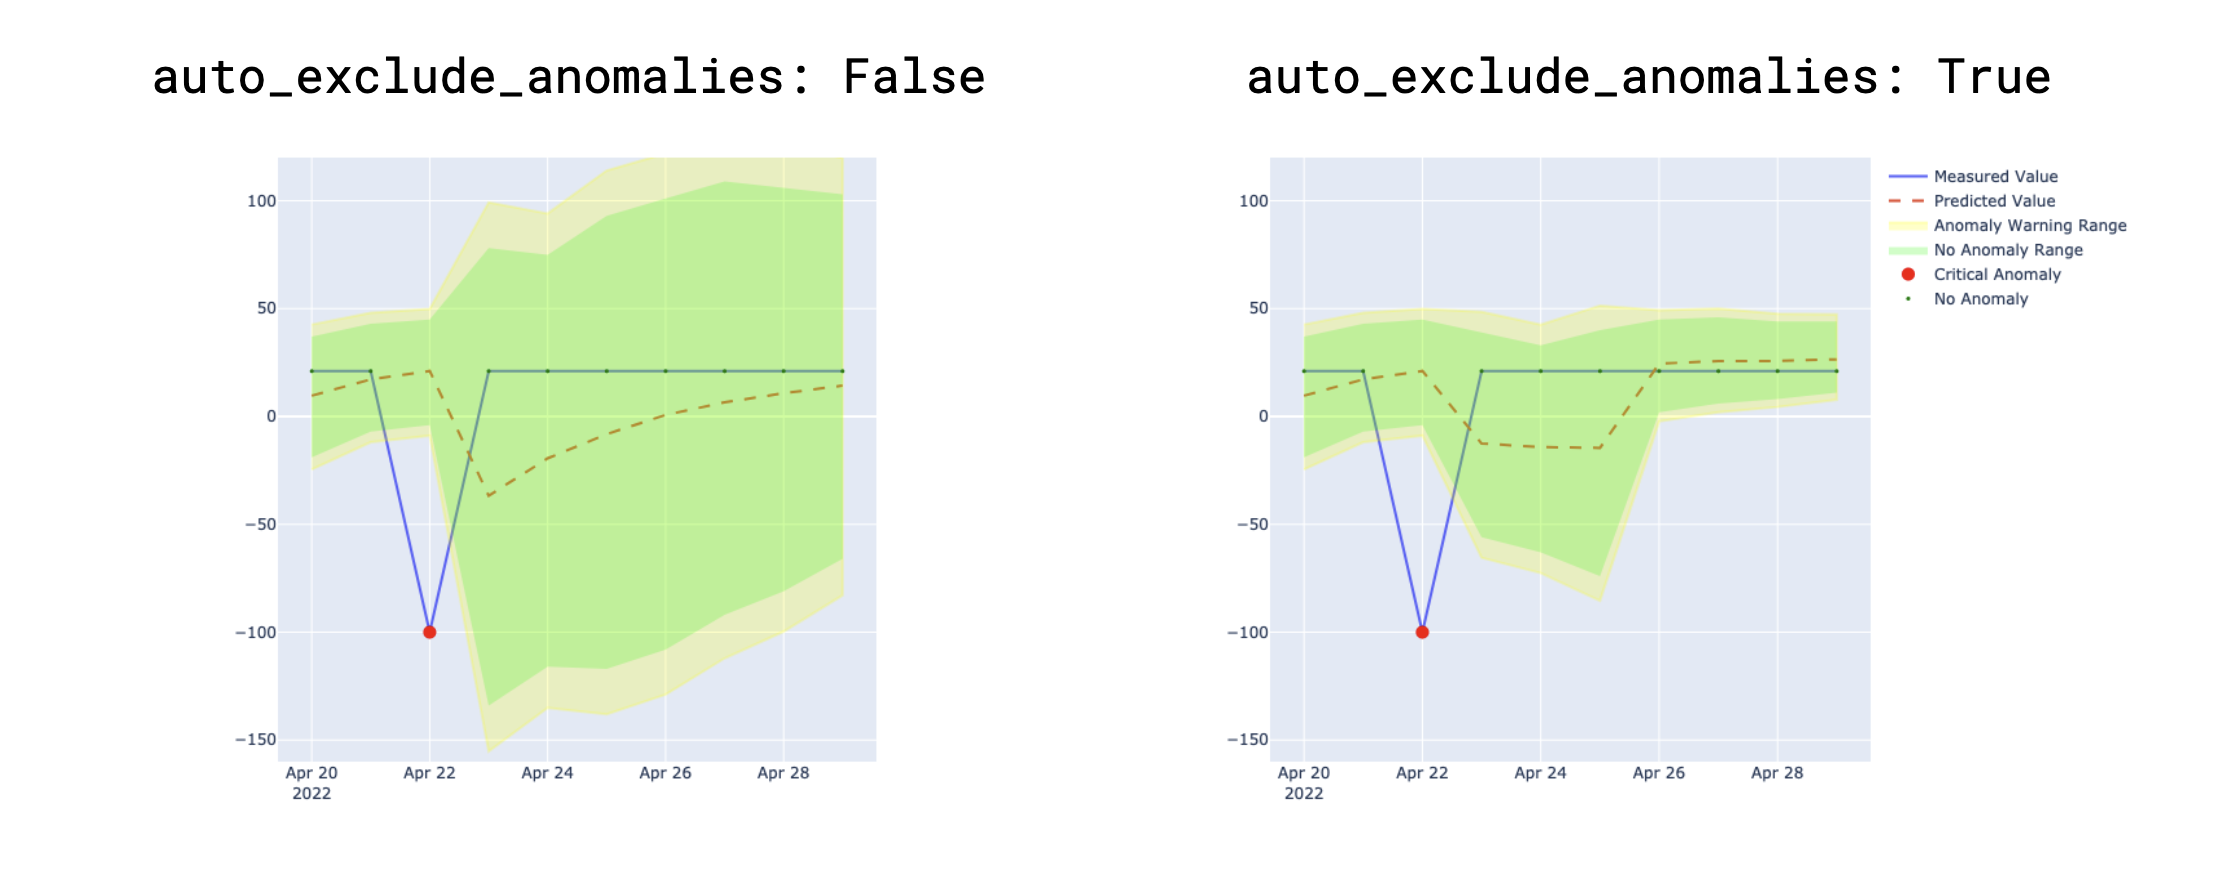
The auto_exclude_anomalies parameter determines whether Soda ignores, or includes unusual data points in the training dataset. When set to True, Soda excludes anomalies from future model training, without the need to manually provide feedback input in the Soda Cloud user interface. Though excluded from the training dataset, Soda still issues alerts when new anomalies occur.
To understand the effect of the parameter, the examples below present the difference between settings. In the image on the left, the parameter is set to False, so Soda includes existing, recorded anomalies in the training dataset which leads to broader confidence intervals indicated in green and yellow. In contrast, with the parameter to True, as in the image on the right, Soda excludes existing anomalies in the training dataset resulting in narrower confidence intervals over time.
Add optional alert directionality configuration
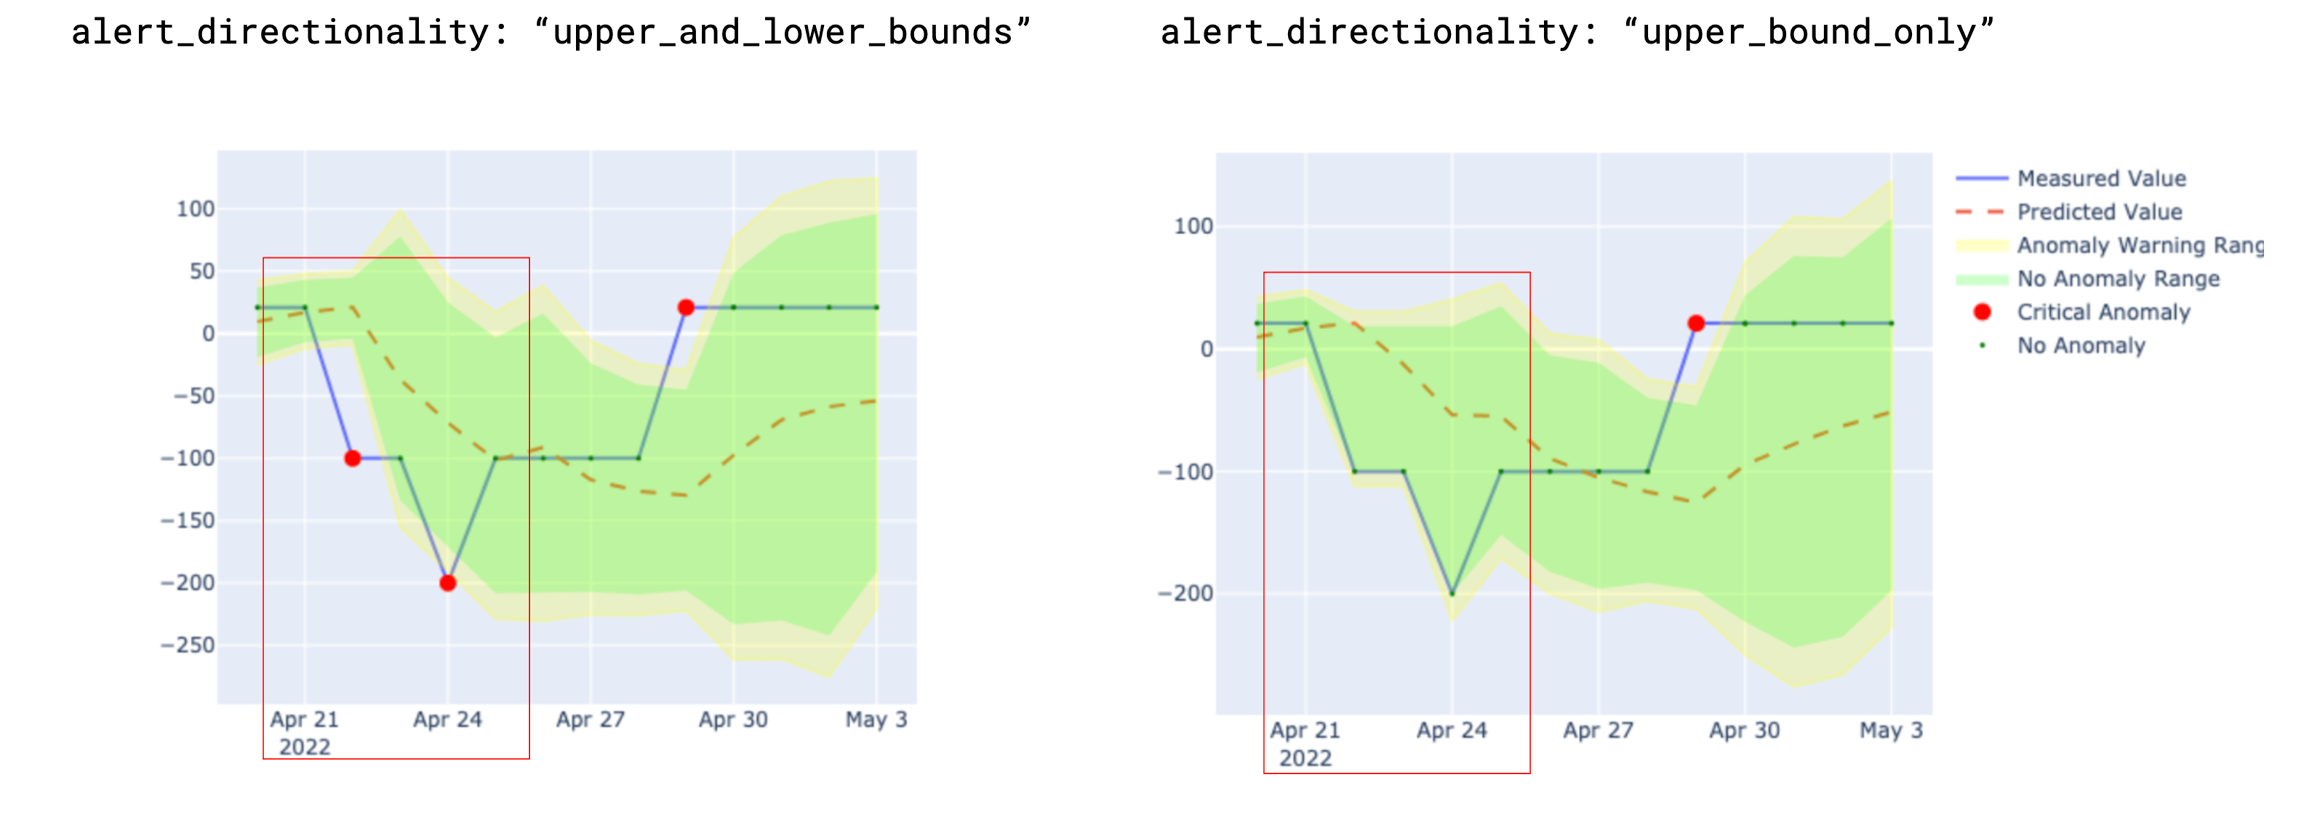
The alert_directionality setting lets you choose which types of anomalies you want to receive alerts for. For example, if you only want to be alerted about unusually low values (and not high ones), set alert_directionality: "lower_bound_only".
By default, alert_directionality is set to "upper_and_lower_bounds", which means you'll get alerts for both high and low anomalies, just like before this option was available. If you prefer not to be alerted about values that fall below the lower confidence interval, switch to "upper_bound_only", as shown in the right of the image below.
Add optional model configurations
The anomaly detection check uses Facebook Prophet to train the model that detects anomalies. If you wish, you can add a model configuration to customize the hyperparameters and tune the model.
Facebook Prophet uses a variety of hyperparameters that influence the model's ability to accurately detect anomalies in time-series data. Because fine-tuning these customizable parameters can be quite complex, Soda offers two out-of-the-box, fine-tuned profiles that automatically optimize the model's performance according to your anomaly sensitivity preference.
There are two values you can use for the profile parameter:
coverageMAPEalternatively, you can customize your own hyperparameters; see below
type
prophet
prophet
profile
coverage
MAPE
coverage
For each of these values, Soda has adjusted the values of a few of the model's hyperparameters to tailor its sensitivity to anomalies, particularly the changepoint_prior_scale and seasonality_prior_scale hyperparameters.
coverage refers to the concept of coverage and represents the percentage of actual measurements within the model's predicted confidence intervals. For example, if a model forecasts a sales between 10-20 units on certain days and 90 out of 100 actual sales figures fall within this range, the coverage is 90%. This coverage-optimized profile is more tolerant of small noises in the data that can lead to falsely-identified anomalies since it has larger confidence intervals to cover as much as possible. However, the model might underfit the data if there is a fluctuating pattern.
For reference, the following lists the hyperparameters that Soda has set for the coverage profile.
The MAPE value refers to mean absolute percentage error (MAPE) which is a statistical measure of how accurate a forecasting method is. It calculates the average percentage error between the forecasted and the actual values. This profile aims to maximize prediction precision as the lower the MAPE value, the more accurate the model's predictions are. When optimizing for MAPE, the model is more sensitive to changepoints and seasonal variations, providing a tighter fit to the training data.
For reference, the following lists the hyperparameters that Soda has set for the MAPE profile.
coverage is less sensitive to anomalies than MAPE. If you have set the profile value to coverage and find that the model seems to miss some anomalies, try changing the value to MAPE. Conversely, if you set the value to MAPE and find that the model is mistakenly identifying normal measurements as anomalies, try changing the value to coverage.
See Best practices for model configuration for further guidance.
Customize hyperparameters
If the Soda-tuned profiles do not meet your specific data and forecasting needs for model sensitivity, you can customize the Prophet's hyperparameters using the custom_hyperparameter configuration.
You can modify any hyperparameter supported by Facebook Prophet in the custom_hyperparameters section of your configuration. For in-depth guidance, refer to Prophet's hyperparameter tuning guide.
It is important to note that customized hyperparameters overrides the soda-tuned coverage hyperparameter profile. For example, if you set the changepoint_prior_scale hyperparameter to 0.05 in the custom_hyperparameters section, the model uses this value instead of the 0.001 value set by Soda for the coverage profile. The other hyperparameters remain the same as the coverage profile.
The following example specifies custom values for the seasonality_mode and interval_width hyperparameters; not shown are the remaining parameters set to mimic the coverage profile settings.
Customize country-specific holidays
Add a holidays_country_code parameter to customize your anomaly detection check to account for country-specific holidays. Access the list of available country codes in the public python-holidays repository.
For example, the following configuration accounts for US American holidays in the model.
Facebook Prophet's holidays_prior_scale hyperparameter, defaulted at 10.0, controls how much holidays influence the model. If holidays have a minimal impact on your data, set a lower value for holidays_prior_scale between 0.01 and 10 as in the following example, to decrease holiday sensitivity and ensure more accurate model representation for non-holiday periods.
Add optional dynamic hyperparameter tuning configurations
To dynamically tune Prophet to evaluate and select the best hyperparameters values to use before each scan, you can add a dynamic parameter and any number of optional hyperparameter configurations. Be aware that hyperparameter tuning can be time-consuming and resource-intensive, so best practice dictates that you use these configurations sparingly.
The following offers an example of how to add automatic hyperparameter tuning. This configuration allows the anomaly detection model to adapt and improve over time by identifying the most effective hyperparameter settings for your specific data. Remember to weigh the benefits of improved accuracy against the increased computational demands of this process.
objective_metric
coverage
MSE
RMSE
MAE
MAPE
MDAPE
SMAPE
n/a
parallel
true
false
true
cross_validation_folds
integer
5
parameter_grid
any Prophet-supported hyperparameters
changepoint_prior_scale: [0.001, 0.01, 0.1, 0.5]
seasonality_prior_scale: [0.01, 0.1, 1.0, 10.0]
other hyperparameters set to the defaults in the coverage profile
The objective_metric hyperparameter evaluates the model's performance. You can set the value to use a single string, or a list of strings. If you provide a list, the model optimizes each metric in sequence. In the example above, the model first optimizes for coverage, then SMAPE in the event of a tie. Best practice dictates that you use coverage as the first objective metric, and SMAPE as the second objective metric to optimize for a model that is more tolerant of noise in your data.
The parallel hyperparameter specifies whether the model saves time by using multiprocess to parallelize the cross validations. Set the value to True if you have multiple cores.
The cross_validation_folds hyperparameter sets the number of periods for each cross-validation fold. For example, with the frequency set to daily D and a cross_validation_folds of 5, the model conducts cross-validation in five-day intervals. It trains on the first n-5 days, then tests on the n-4th day. Subsequently, it trains on n-4 days, testing on the n-3rd day, and so on. The cross-validation process computes the objective_metric across different data segments for each hyperparameter combination. The model then uses the best objective_metric according to the value or list of values configured for that hyperparameter.
The parameter_grid hyperparameter is a dictionary that lists hyperparameters and their possible values. The model tests every possible combination of the listed values for each hyperparameter to identify the best value to use to detect anomalies. You can configure any Prophet-supported hyperparameter.
Execution time analysis for dynamic hyperparameter tuning
The execution time for dynamic hyperparameter tuning varies based on several factors including the number of hyperparameters and the number of folds. For example, the default hyperparameter grid has 16 combinations since changepoint_prior_scale and seasonality_prior_scale have four values each. Consider using a small number of hyperparameters to avoid long execution times. By default, the model processes each fold in parallel. If you use multiple cores, you can set the parallel parameter to True to speed up the execution time.
Use the following tables to estimate the execution time for checks with dynamic hyperparameter tuning.
Model Name
MacBook Pro
Model Identifier
MacBookPro18,3
Chip
Apple M1 Pro
Number of Cores
10; 8 performance and 2 efficiency
Memory
16 GB
Yes
4
5
30
2.23 sec
Yes
4
5
90
2.80 sec
Yes
8
5
30
4.5 sec
Yes
8
5
90
6.05 sec
No
4
5
30
5.8 sec
No
4
5
90
8.05 sec
No
4
10
30
7.2 sec
No
4
10
90
10.6 sec
Yes
4
10
30
2.5 sec
Yes
4
10
90
3.06 sec
Best practices for model configurations
Set the value of the
profileparameter tocoverage. This profile is more tolerant of small noises in the data that could lead to falsely identified anomalies. If you need a very sensitive model, then try to useMAPEprofile.Only use the
custom_hyperparametersconfiguration if you know how Facebook Prophet works. Before making any customizations, consult the Facebook Prophet documentation. Thechange_point_prior_scaleandseasonality_prior_scalehyperparameters have the most impact on the model so best practice dictates that you experiment with the values of these two hyperparameters first before customizing or tuning others.Adjust the value of the
interval_widthhyperparameter to obtain a more anomaly-sensitive model. The default value for this hyperparameter is0.999which means that the model applies a confidence interval of 99.9% which, in turn, means that if the predicted value is outside of the 99.9% interval, Soda flags it as an anomaly. If you want to have a more sensitive model, you can decrease this value though be aware that a lower value may result in more falsely-identified anomalies.Use the
dynamictuning configuration only if necessary. Hyperparameter tuning is a computationally expensive process since the model tries all possible combinations of each hyperparameter's listed values to dynamically determine the best value to use to detect anomalies. See Execution time analysis for dynamic hyperparameter tuning. If you need to use hyperparameter tuning, experiment with tuning the values of thechange_point_prior_scaleandseasonality_prior_scalehyperparameters first as these two have the most impact on the model's sensitivity.
Test optional configuration using a simulator
Requires Soda Library CLI
Soda provides an anomaly detection simulator to enable you to test and observe how parameter adjustments you make impact the algorithm's confidence interval and anomaly detection sensitivity. The purpose of this local, streamlit simulator application is to help you to choose the most suitable parameter settings for your anomaly detection needs.
From the command-line, install the simulator package using the following command.
4. To launch the application, use the following command. After running the command, a new tab opens in your default browser displaying the simulator as shown in the screenshot below.
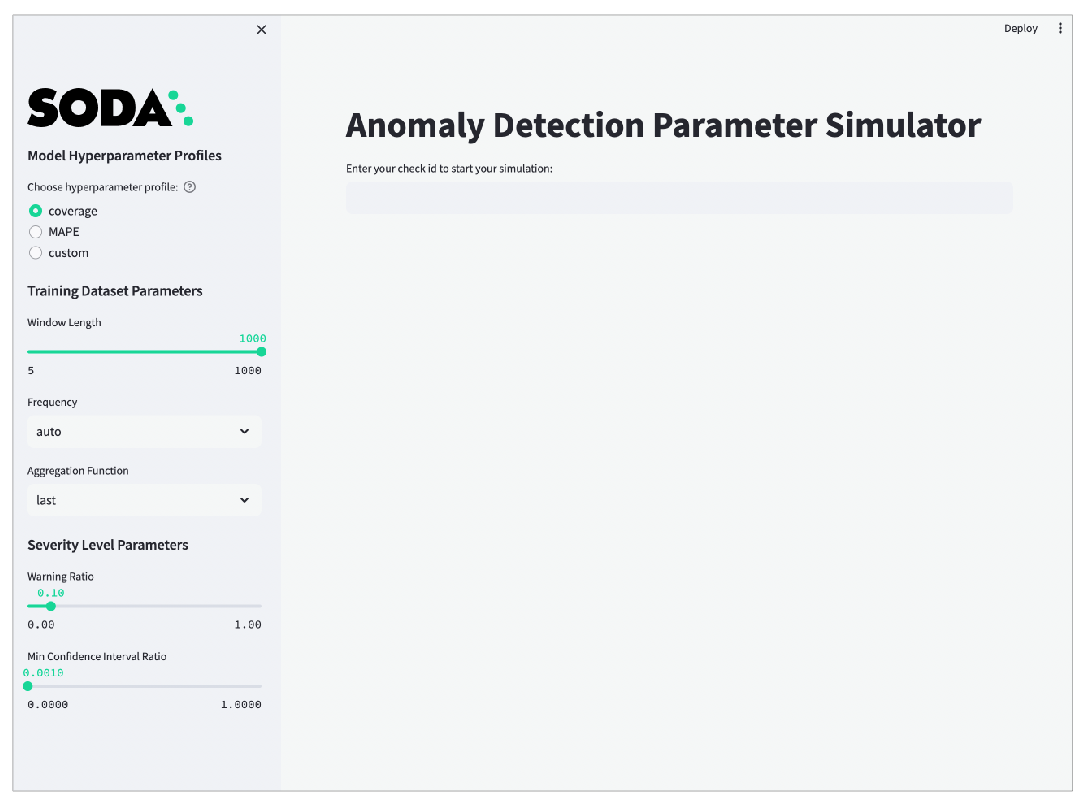
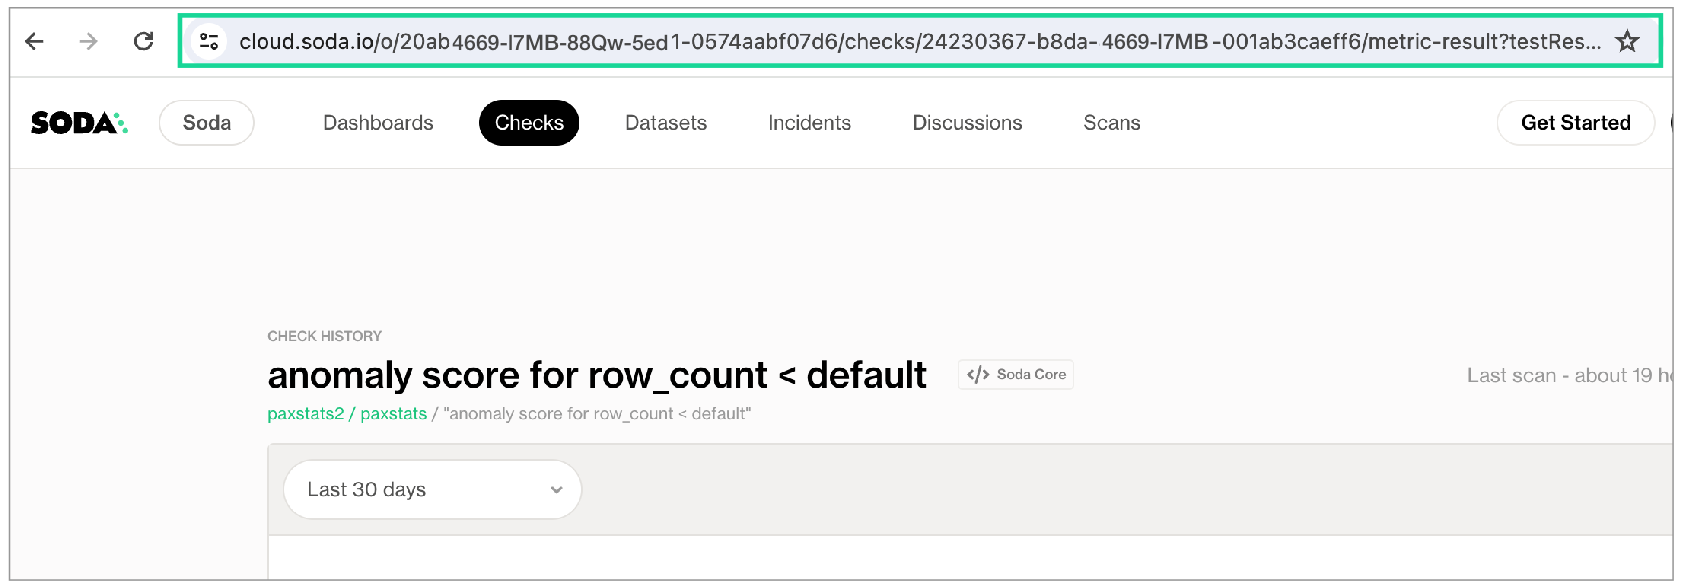
Paste the check URL you copied for your anomaly check into the main field and press enter. Refer to the screenshot below.

Use the slider that appears to simulate the most recent
nmeasurements, ideally not more than 60 so as to keep the simulator execution time reasonable.Click Start Simulation to display graphic results using the default parameter values.
Use the tools in the sidebar to adjust parameter settings until the simulator displays your ideal anomaly sensitivity results. Apply your optimized parameter settings to the check configuration in your checks YAML file.
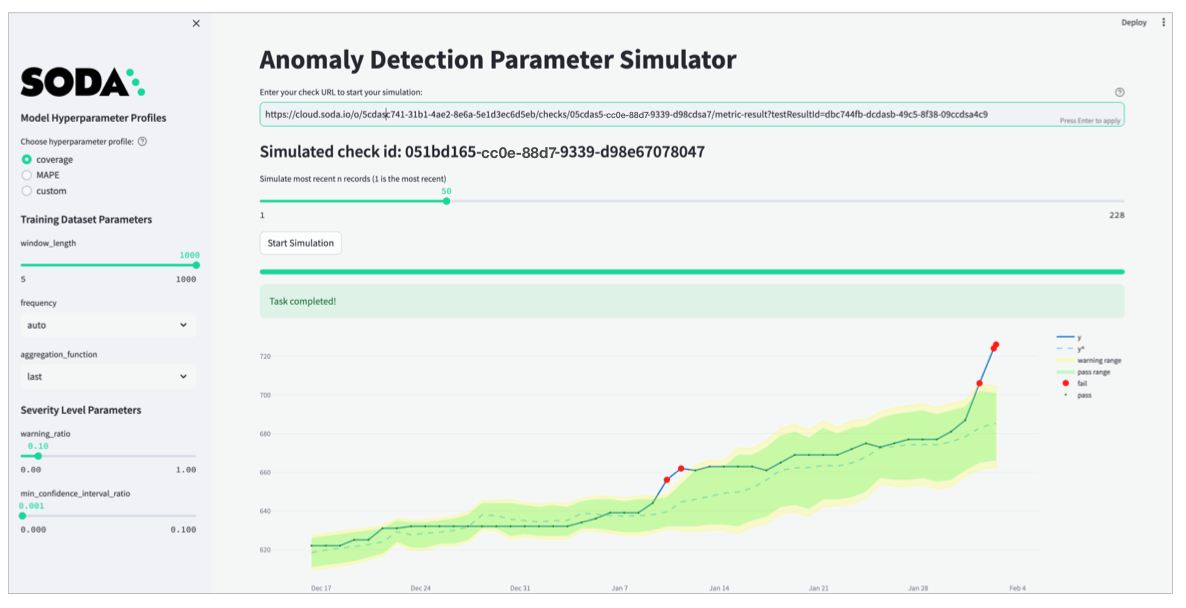
Adjust advanced simulator parameters
For Model Hyperparameter Profiles, the first two options correspond with the coverage, MAPE profiles described in Add optional model configuration, and the third option, custom corresponds to the ability to Customize hyperparameter. Experiment with the coverage and MAPE profiles first, before considering the custom profile.
For further hyperparameter customization, turn on the Advanced toggle in the simulator and edit hyperparameters in the Custom Prophet Hyperparameters field which accepts JSON, as in the example below. Note that if you do not specify a customized value for a hyperparameter, Soda uses the default values from the coverage profile.
For Training Dataset Parameters, the adjustable settings correspond to the parameters in Add optional training dataset configurations.
For Severity Level Parameters, the adjustable settings correspond to the parameters in Manage alert severity levels.
Address common anomaly detection issues
What follows are some examples of how to adjust optional configurations to address common issues with the sensitivity of anomaly detection checks.
Insensitive detection
The default coverage hyperparameter profile is more tolerant of small noises in data quality measurements. However, as in the following example, the profile may not be sensitive enough if there are fluctuating data patterns. This is because the coverage profile uses a low changepoint_prior_scale=0.001 value and a low seasonality_prior_scale=0.01 which make the model less sensitive to changepoints.
As in the following graph, the predicted yˆ values produce a steady trend and the algorithm does not capture the fluctuating pattern of the actual measurements. As a result, it missed the anomaly in the red rectangle.

In such a case, consider using the MAPE profile which is more sensitive to changepoints and seasonal variations.
With the profile set to MAPE, the model uses higher changepoint_prior_scale=0.1 and seasonality_prior_scale=0.1 values which makes it more sensitive to changepoints and seasonal variations. The graph below illustrates the higher sensitivity wherein the algorithm recognizes more measurements as anomalous. As a result, yˆ values better capture the fluctuating pattern of the actual measurements over time.

Consecutive falsely-identified anomalies
To decrease the rate of falsely-detected anomalies, Soda optimized the default hyperparameters of the anomaly detection check to detect anomalies in time-series data which exhibits a stable pattern. If the data exhibits pattern changes, as illustrated in the graph below, you may need to adjust the default parameters to improve the model's ability to detect anomalies to prevent alert fatigue.
As an example, the graph below indicates that up until November 2023, the data follows a stable pattern and the coverage profile is sufficient to detect anomalies. However, after November 2023, the pattern changes and the model needs to adapt to the new pattern. The default coverage profile has very low changepoint_prior_scale=0.001 and seasonality_prior_scale=0.01 values which makes the model insensitive for the trend changes. For this reason, during the adaptation period, the model falsely identified consecutive measurements as anomalies for a long time; refer to the red rectangle in the graph below.

In such a case, consider using the MAPE as the first action as it is explained in the previous section. Because the MAPE profile is more sensitive, it converges faster than the coverage profile when a pattern changes; see graph below.

The MAPE profile achieves a much better fit since yˆ values closely follow the actual measurements. Compared to the coverage profile, MAPE causes fewer false positives but it still falsely identifies consecutive measurements as anomalies for a long time. This is because the model uses the last 1000 measurements to gauge pattern changes and it takes time to adapt to the new pattern which, in this case, is a weekly seasonality.
Each Monday, there is a jump in the y value and the other days follow a steady increase. Thus, using last four weeks' data points, or the 30 measurements, is a better way to calibrate the model than using the last 1000 measurements so it can capture the weekly seasonality effect. In such a case, consider decreasing the window_length parameter to 30 or experiment with different values to find the optimal window_length for your data and business use case. Refer to the default model configurations for guidance.
Having adjusted the window_length and MAPE profile, the graph below illustrates that the model is more sensitive to recent measurements and does not create alert fatigue after November 2023; refer to the green rectangle.

Large boundaries that ignore anomalies
Anomalous records can confuse the model and cause excessively large confidence intervals if the model does not ignore anomalous measurements. Consider the graph below: because of the anomalies in the red rectangle, the model's confidence interval is very large and the model is not sensitive to anomalies in the blue rectangle.

The anomalies create larger intervals because the model uses them for training data. To address the issue, consider removing these anomalous records from the training dataset. Use Soda Cloud to ignore the anomalies in the red rectangle by using the Feedback feature. Hover over the anomalous measurement in your anomaly detection check page, then click the Feedback button and choose to Ignore this value in future anomaly detection as in the screenshot below.
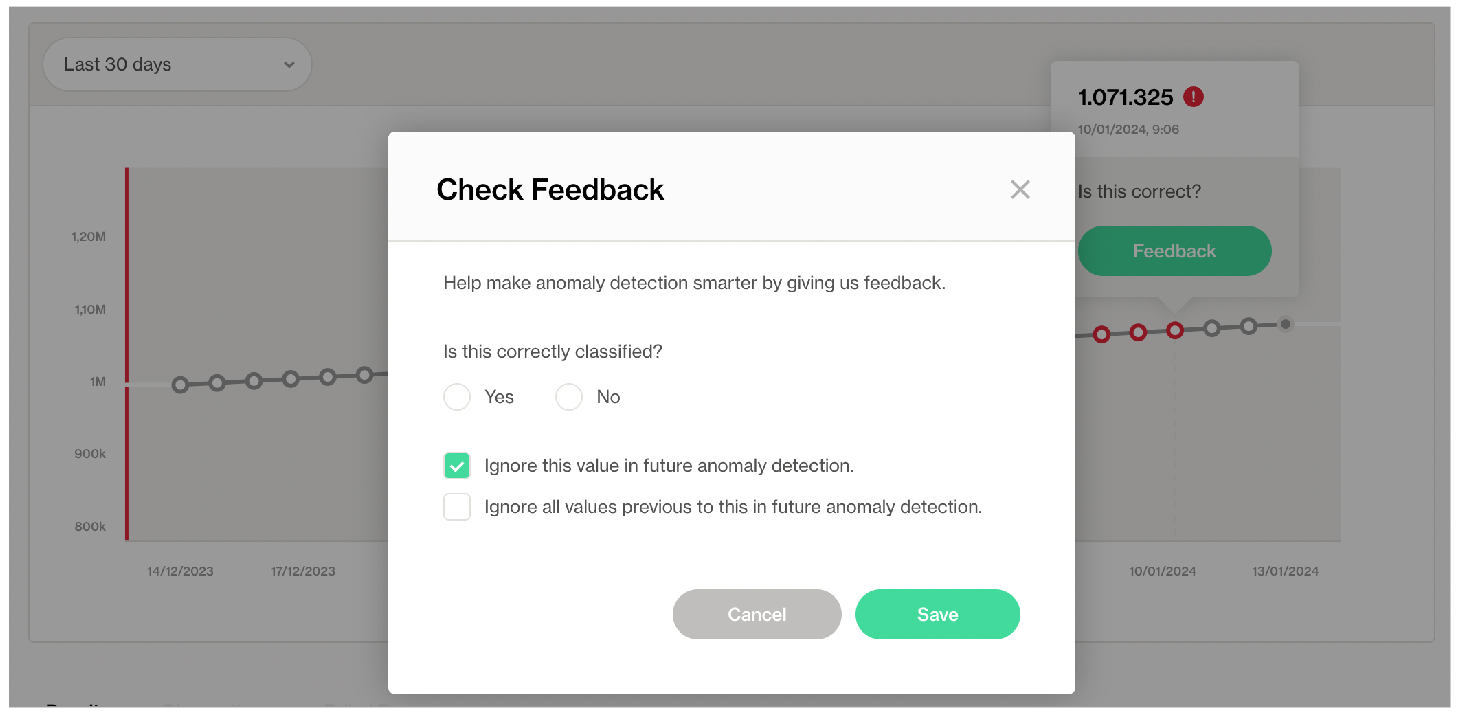
After instructing Soda to ignore the anomalous measurements, the model's confidence interval is smaller and the model is more sensitive to anomalies, as indicated in the graph below.

Track anomalies and relative changes by group
You can use a group by configuration to detect anomalies by category, and monitor relative changes over time in each category.
✔️ Requires Soda Core Scientific for anomaly check (included in a Soda Agent) ✖️ Supported in Soda Core ✔️ Supported in Soda Library 1.1.27 or greater + Soda Cloud ✔️ Supported in Soda Cloud Agreements + Soda Agent 0.8.57 or greater ✖️ Available as a no-code check
The following example includes three checks grouped by gender.
The first check uses the custom metric
average_childrento collect measurements and gauge them against an absolute threshold of2. Soda Cloud displays the check results grouped by gender.The second check uses the same custom metric to detect anomalous measurements relative to previous measurements. Soda must collect a minimum of four, regular-cadence, measurements to have enough data from which to gauge an anomolous measurement. Until it has enough measurements, Soda returns a check result of
[NOT EVALUATED]. Soda Cloud displays any detected anomalies grouped by gender.The third check uses the same custom metric to detect changes over time in the calculated average measurement, and gauge the measurement against a threshold of
between -5 and 5relative to the previously-recorded measurement. See Change-over-time thresholds for supported syntax variations for change-over-time checks. Soda Cloud displays any detected changes grouped by gender.

Troubleshoot Soda Scientific installation
While installing Soda Scientific works on Linux, you may encounter issues if you install Soda Scientific on Mac OS (particularly, machines with the M1 ARM-based processor) or any other operating system. If that is the case, consider using one of the following alternative installation procedures.
Need help? Ask the team in the Soda community on Slack.
Install Soda Scientific Locally
Set up a virtual environment, and install Soda Library in your new virtual environment.
Use the following command to install Soda Scientific.
List of Soda Scientific dependencies
pandas<2.0.0
wheel
pydantic>=1.8.1,<2.0.0
scipy>=1.8.0
numpy>=1.23.3, <2.0.0
inflection==0.5.1
httpx>=0.18.1,<2.0.0
PyYAML>=5.4.1,<7.0.0
cython>=0.22
prophet>=1.1.0,<2.0.0
Use Docker to run Soda Library
Use Soda’s Docker image in which Soda Scientific is pre-installed. You need Soda Scientific to be able to use SodaCL distribution checks or anomaly detection checks.
If you have not already done so, install Docker in your local environment.
From Terminal, run the following command to pull Soda Library’s official Docker image; adjust the version to reflect the most recent release.
Verify the pull by running the following command.
Output:
When you run the Docker image on a non-Linux/amd64 platform, you may see the following warning from Docker, which you can ignore.
When you are ready to run a Soda scan, use the following command to run the scan via the docker image. Replace the placeholder values with your own file paths and names.
Optionally, you can specify the version of Soda Library to use to execute the scan. This may be useful when you do not wish to use the latest released version of Soda Library to run your scans. The example scan command below specifies Soda Library version 1.0.0.
What does the scan command do?
docker runensures that the docker engine runs a specific image.-vmounts your SodaCL files into the container. In other words, it makes the configuration.yml and checks.yml files in your local environment available to the docker container. The command example maps your local directory to/sodaclinside of the docker container.sodadata/soda-libraryrefers to the image thatdocker runmust use.scaninstructs Soda Library to execute a scan of your data.-dindicates the name of the data source to scan.-cspecifies the filepath and name of the configuration YAML file.
Error: mounts denied
If you encounter the following error, follow the procedure below.
You need to give Docker permission to acccess your configuration.yml and checks.yml files in your environment. To do so:
Access your Docker Dashboard, then select Preferences (gear symbol).
Select Resources, then follow the Docker instructions to add your Soda project directory—the one you use to store your configuration.yml and checks.yml files—to the list of directories that can be bind-mounted into Docker containers.
Click Apply & Restart, then repeat steps 2 - 4 above.
Error: Configuration path does not exist
If you encounter the following error, double check the syntax of the scan command in step 4 above.
Be sure to prepend
/sodacl/to both the congifuration.yml filepath and the checks.yml filepath.Be sure to mount your files into the container by including the
-voption. For example,-v /Users/MyName/soda_project:/sodacl.
Troubleshoot Soda Scientific installation in a virtual env
If you have defined an anomaly detection check and you use an M1 MacOS machine, you may get aLibrary not loaded: @rpath/libtbb.dylib error. This is a known issue in the MacOS community and is caused by issues during the installation of the prophet library. There currently are no official workarounds or releases to fix the problem, but the following adjustments may address the issue.
Install
soda-scientificas per the local environment installation instructions and activate the virtual environment.Use the following command to navigate to the directory in which the
stan_modelof theprophetpackage is installed in your virtual environment.For example, if you have created a python virtual environment in a
/venvsdirectory in your home directory and you use Python 3.9, you would use the following command.Use the
lscommand to determine the version number ofcmndstanthatprophetinstalled. Thecmndstandirectory name includes the version number.Add the
rpathof thetbblibrary to yourprophetinstallation using the following command.With
cmdstanversion2.26.1, you would use the following command.
Go further
Learn more about the anomaly dashboard for datasets.
Reference tips and best practices for SodaCL.
Need help? Join the Soda community on Slack.
Last updated
Was this helpful?
