Build a Grafana dashboard
This example helps you build a customized data quality reporting dashboard in Grafana using the Soda Cloud API.
This guide offers an example of how to create a data quality reporting dashboard using the Soda Cloud API and Grafana. Such a dashboard enables data engineers to monitor the status of Soda scans and capture and display check results.
Use the Soda Cloud API to trigger data quality scans and extract metadata from your Soda Cloud account, then store the metadata in PostgreSQL and use it to customize visualized data quality results in Grafana.

Prerequisites
access to a Grafana account
Python 3.8, 3.9, or 3.10
familiarity with Python, with Python library interactions with APIs
access to a PostgreSQL data source
a Soda Cloud account: Sign Up
permission in Soda Cloud to access dataset metadata; see Manage dataset roles
at least one agreement or no-code check associated with a scan definition in Soda Cloud; see Use no-code checks
Choose a scan definition
Because this guide uses the Soda Cloud API to trigger a scan execution, you must first choose an existing check in Soda Cloud to identify its associated scan definition, which you will use to identify which checks to execute during the triggered scan.
See also: Trigger a scan via API
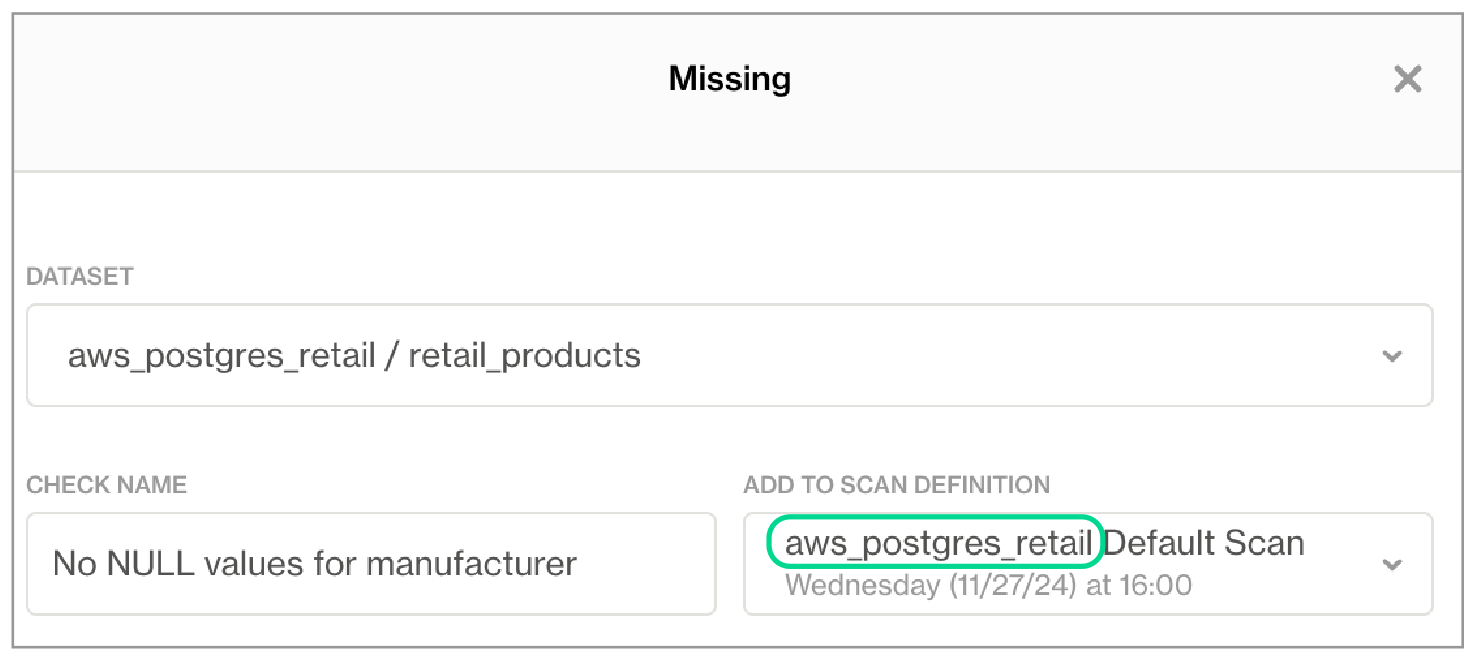
Log in to your Soda Cloud account and navigate to the Checks page. Choose a check that originated in Soda Cloud, identifiable by the cloud icon, that you can use to complete this exercise. Use the action menu (stacked dots) next to the check to select Edit Check.

In the dialog that opens, copy the scan definition name from the Add to Scan Definition field. Under Scans, above the scan definition name, copy the scan definition ID that uses undescores to represent spaces. Paste the scan definition ID in a temporary local file; you will use it in the next steps to trigger a scan via the Soda Cloud API.

Be aware that when you use the Soda Cloud API to trigger the execution of this scan definition remotely, Soda executes all checks associated with the scan definition. This is a good thing, as you can see the metadata for multiple check results in the Grafana dashboard this guide prepares.
Prepare to use the Soda Cloud API
As per best practice, set up a new Python virtual environment so that you can keep your projects isolated and avoid library clashes. The example below uses the built-in venv module to create, then navigate to and activate, a virtual environment named
soda-grafana. Rundeactivateto close the virtual environment when you wish.Run the following command to install the requests libraries in your virtual environment that you need to connect to Soda Cloud API endpoints. Because this exercise moves the data it extracts from your Soda Cloud account into a PostgreSQL data source, it requires the
psycopg2library. Alternatively, you can list and save all the requirements in arequirements.txtfile, then install them from the command-line usingpip install -r requirements.txt. If you use a different type of data source, find a corresponding plugin, or check SQLAlchemy's built-in database compatibility.
In the same directory, create a new file named
apiscan.py. Paste the following contents into the file to define an ApiScan class, which you will use to interact with the Soda Cloud API.From the command-line, create the following environment variables to facilitate a connection to your Soda Cloud account and your PostgreSQL data source.
SODA_URL: usehttps://cloud.soda.io/api/v1/orhttps://cloud.us.soda.io/api/v1/as the value, according to the region in which you created your Soda Cloud account.API_KEYandAPI_SECRET: see Generate API keys
Troubleshoot
Problem: You get an error that reads, "psycopg2 installation fails with error: metadata-generation-failed" and the suggestion "If you prefer to avoid building psycopg2 from source, please install the PyPI 'psycopg2-binary' package instead."
Solution: As suggested, install the binary package instead, using pip install psycopg2-binary.
Trigger and monitor a Soda scan
In the same directory in which you created the
apiscan.pyfile, create a new file namedmain.py.To the file, add the following code which:
imports necessary libraries, as well as the ApiScan class from
apiscan.pyinitializes an
ApiScanobject asascan, uses the object to trigger a scan withscan_definitionas a parameter which, in this case, isgrafanascan0; replacegrafanascan0with the scan definition ID you copied to a local file earlier.stores the scan
idas a variablechecks the state of the scan every 10 seconds, then only when it is in a completion state (
completedWithErrors,completedWithFailures,completedWithWarnings, orcompleted), stores the scan results as variabler.
Extract scan results
To the main.py file, add the following code which:
extracts Soda scan details, from the scan results stored in variable
rextracts dataset details, using Soda Cloud API's datasets endpoint
extracts checks details, using Soda Cloud API's checks endpoint
combines scan, dataset and checks details into one dictionary per check, and appends the dictionary to a list of checks
Process scan results into a PostgreSQL data source
The following example code serves as reference for adding data to a PostgreSQL data source. Replace it if you intend to store scan results in another type of data source.
To the
main.pyfile, add the code below which:
connects to a PostgreSQL data source, using the psycopg2 library
creates a table in the data source in which to store scan results, if one does not already exist
processes the list of dicts, and inserts them into table of scan results
From the command-line, run
python3 main.py.
Visualize scan results in a Grafana dashboard
Log into your Grafana account, select My Account, then launch Grafana Cloud.
Follow Grafana's PostgreSQL data source instructions to add your data source which contains the Soda check results.
Follow Grafana's Create a dashboard instructions to create a new dashboard. Use the following details for reference in the Edit panel for Visualizations.
In the Queries tab, configure a Query using Builder or Code, then Run query on the data source. Toggle the Table view at the top to see Query results.
In the Transformations tab, create, edit, or delete Transformations that transform Query results into the data and format that Visualization needs.
Access Grafana's Visualizations documentation for guidance on Visualizations.
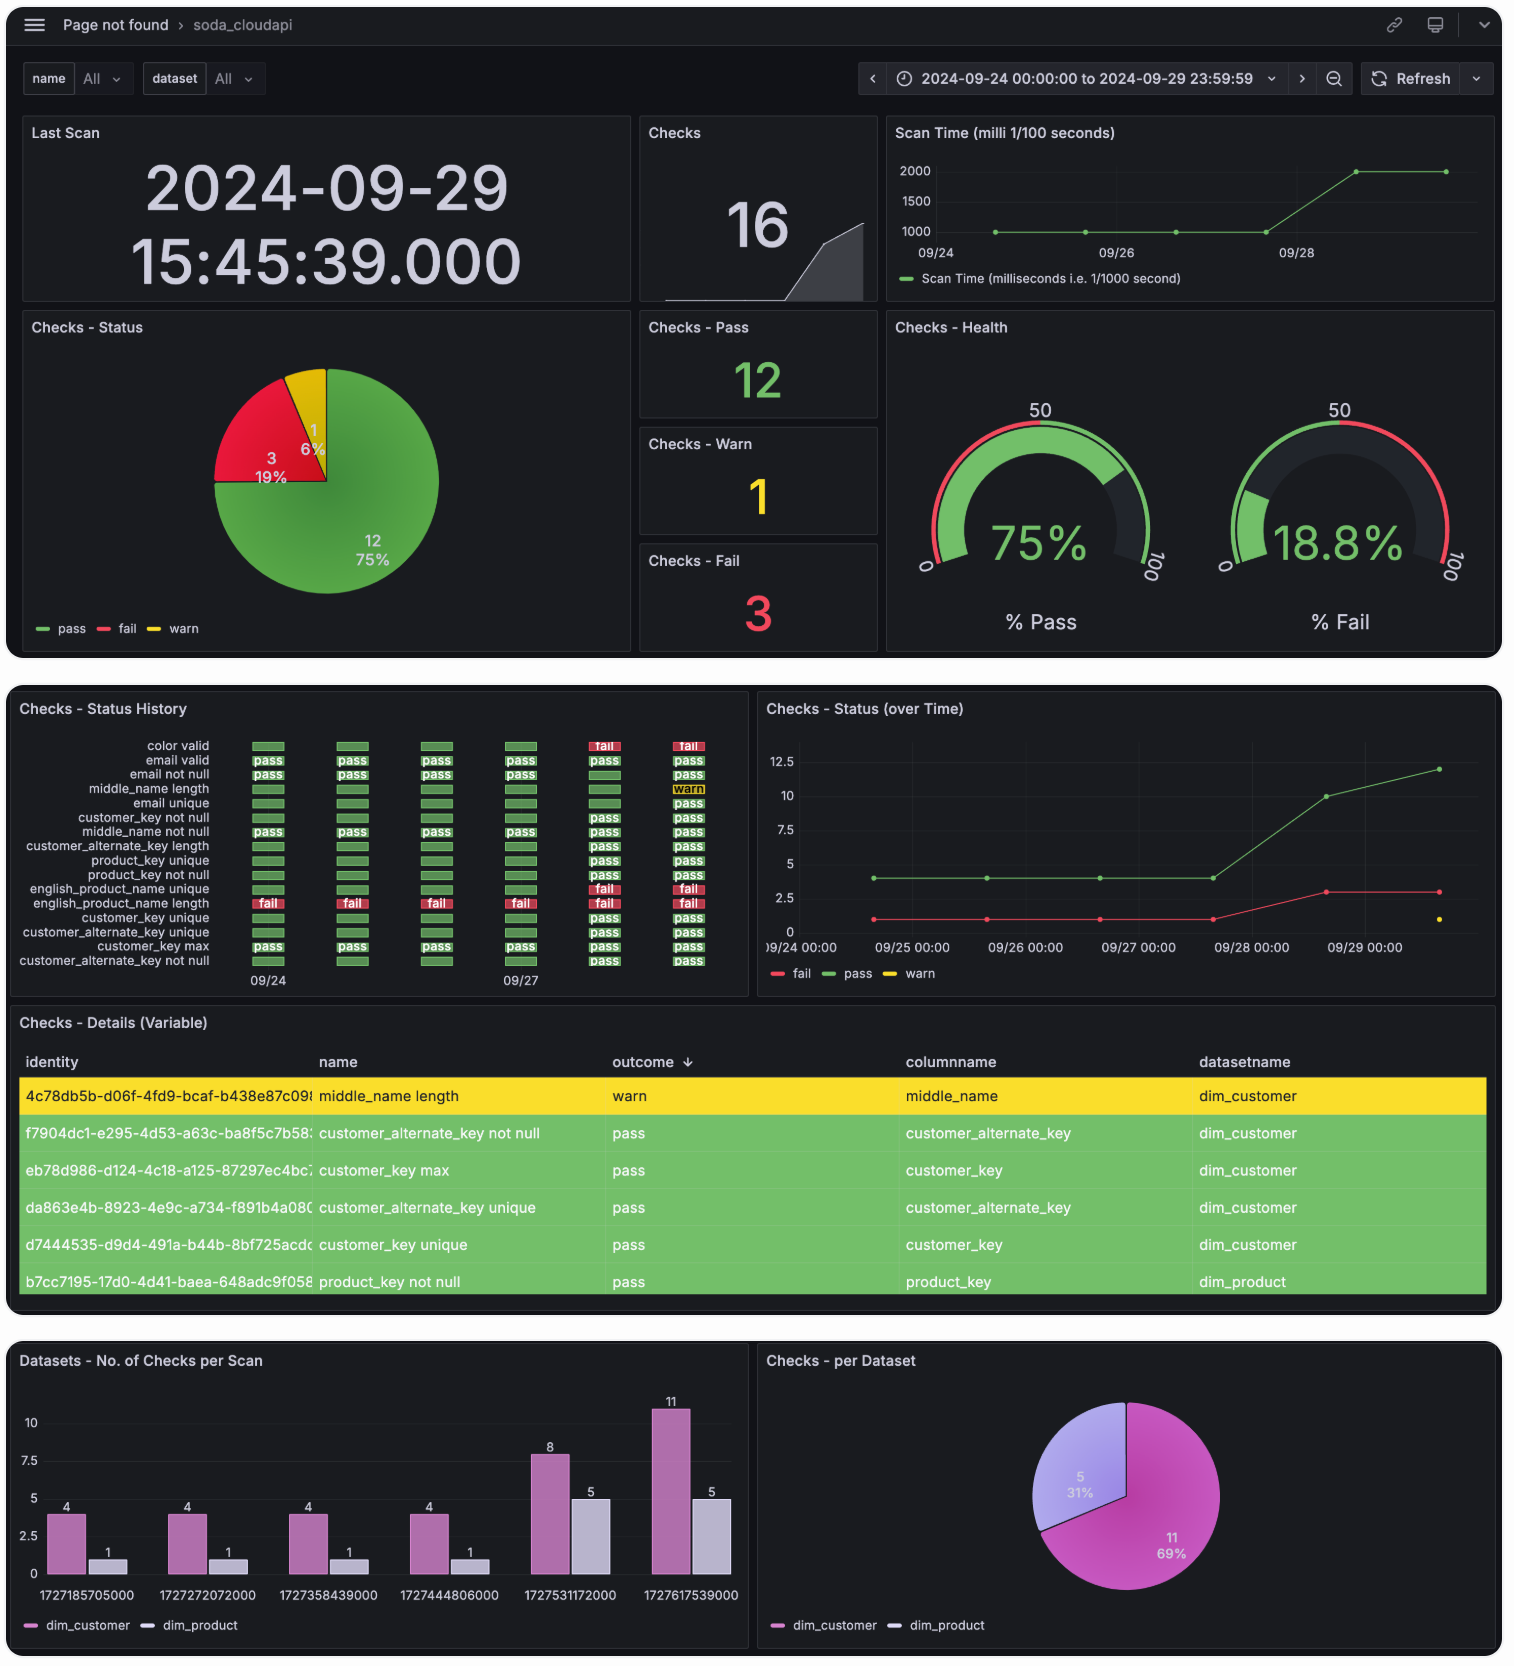
The example code included in this guide produces the following visualizations.

Go further
Access full Soda Cloud API and Soda Cloud Reporting API documentation.
Learn more about remotely running a Doda scan.
Need help? Join the Soda community on Slack.
Last updated
Was this helpful?
