> For the complete documentation index, see [llms.txt](https://docs.soda.io/llms.txt). Markdown versions of documentation pages are available by appending `.md` to page URLs; this page is available as [Markdown](https://docs.soda.io/soda-documentation/data-observability/metric-monitoring-dashboard/group-by-monitors.md).
# Group By monitors
**Group By monitors** enable you to track data quality metrics across specific segments of your dataset. Instead of monitoring a metric for a column as a whole, you can break it down per category (for example, per region, per school year, per status).
This functionality is especially valuable when:
* You want to detect anomalies at a more granular level, within each segment or category.
* You need visibility into how data quality differs across categories.
* You want to monitor trends and patterns that would otherwise be hidden in aggregated metrics.
{% hint style="warning" %}
**Only one Group By monitor can be configured at a time**.
Because a Group By monitor spawns multiple monitors (one per category), limiting this to a single configuration helps manage performance.
{% endhint %}
## Explore Group By monitors
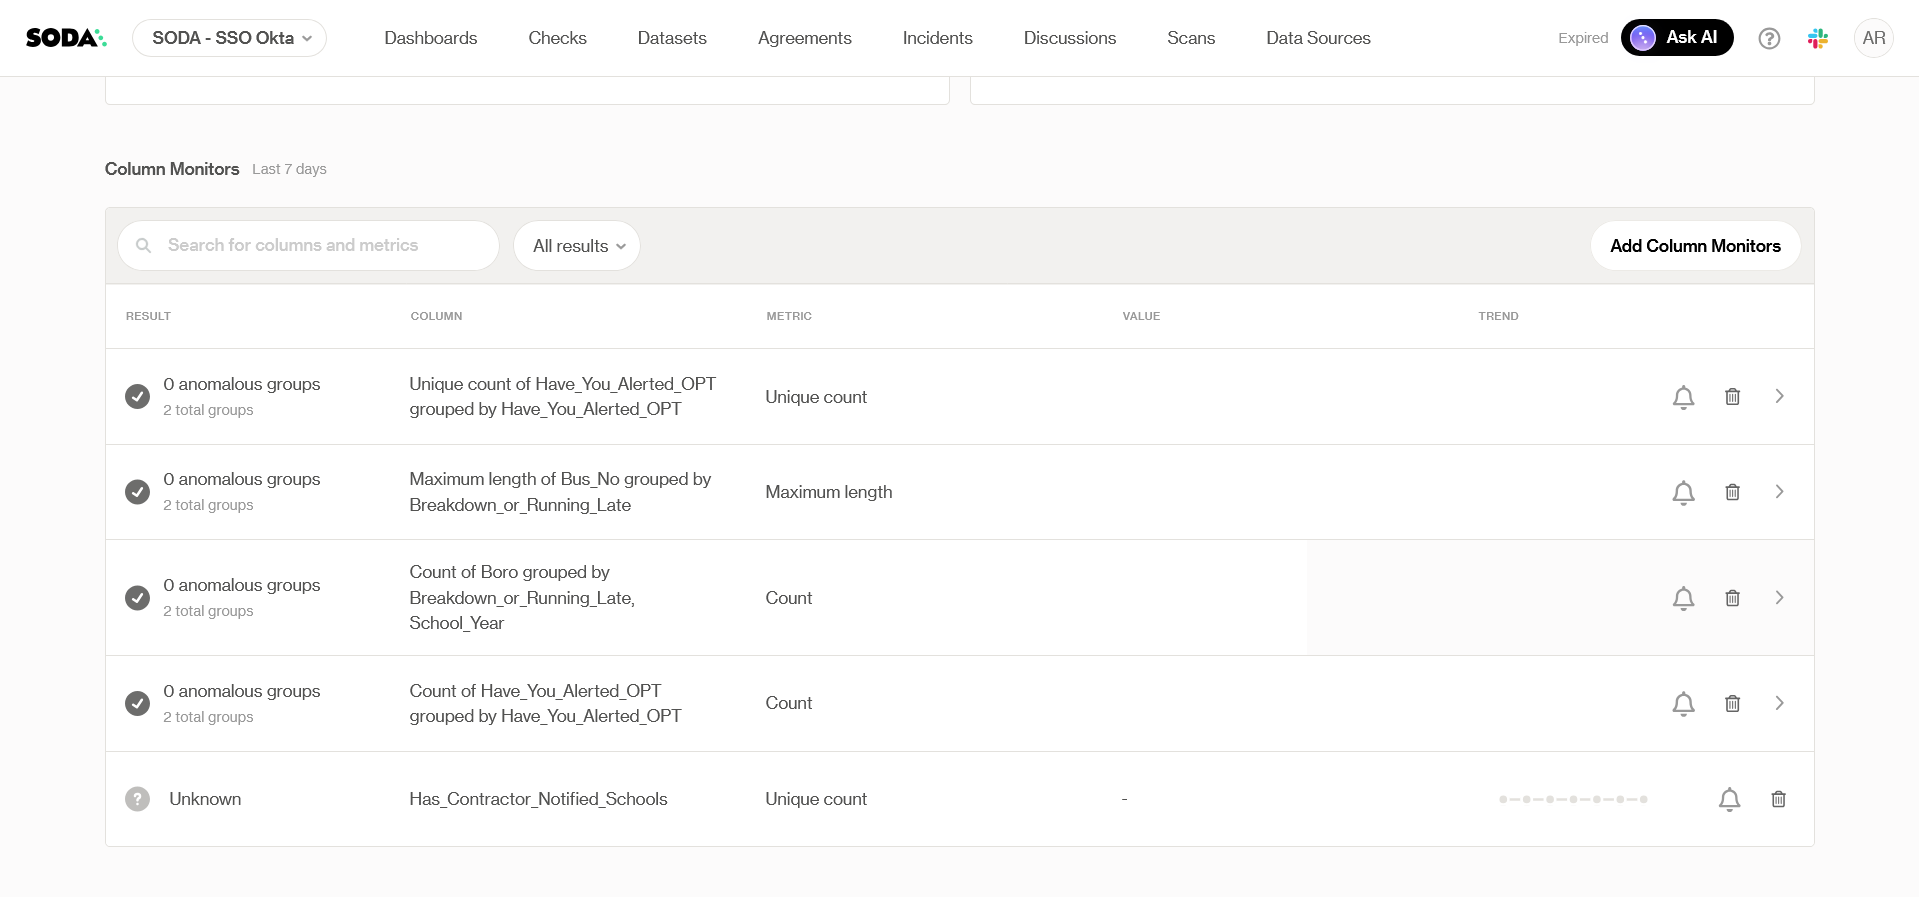
When a Group By monitor is active in a dataset, results are displayed at the bottom of the **Metric Monitors tab**, on the **Column Monitors table:**
There, you will see:
#### Entry in Column Monitors table
A Group By monitor is listed like any other monitor, but its description indicates the Group By column(s) and the metric being measured (e.g. "Maximum length of `Bus_No` grouped by `Breakdown_or_Running_Late`").
{% hint style="info" %}
Group By monitors will **always be displayed at the top** of the Column Monitors table, even when no anomalous groups were detected.
{% endhint %}
From the Column Monitors table, it is possible to **turn on notifications at the column level** by clicking on the **bell icon**. Note that notifications at a category level are not available at the moment.
#### Groups table
Expanding the monitor displays a groups table, which shows the results for each group or category. Each row corresponds to one category (or combination of categories if multiple columns are grouped).\
From the groups table, it is possible to **delete specific categories** by clicking on the **bin icon** on the right.
{% hint style="danger" %}
Deleting from the groups table is intended to **remove groups/categories that are no longer present in the data**.
* Deleting a category **removes the history** for that monitor.
* If the group/category is still present in the data, **the monitor will be re-created on the next scan**. **It will not be backfilled**, unless a historical metric collection scan is triggered.
{% endhint %}
**Example:**
**Group By** `Breakdown_or_Running_Late` **+ metric** `Maximum length of Bus_No` → a row for each `Breakdown_or_Running_Late` value, with the maximum bus number length observed in that category, alongside its anomaly detection status.
## Add Group By monitors
You can add a Group By monitor from the **Metric Monitors** section of the dataset page.
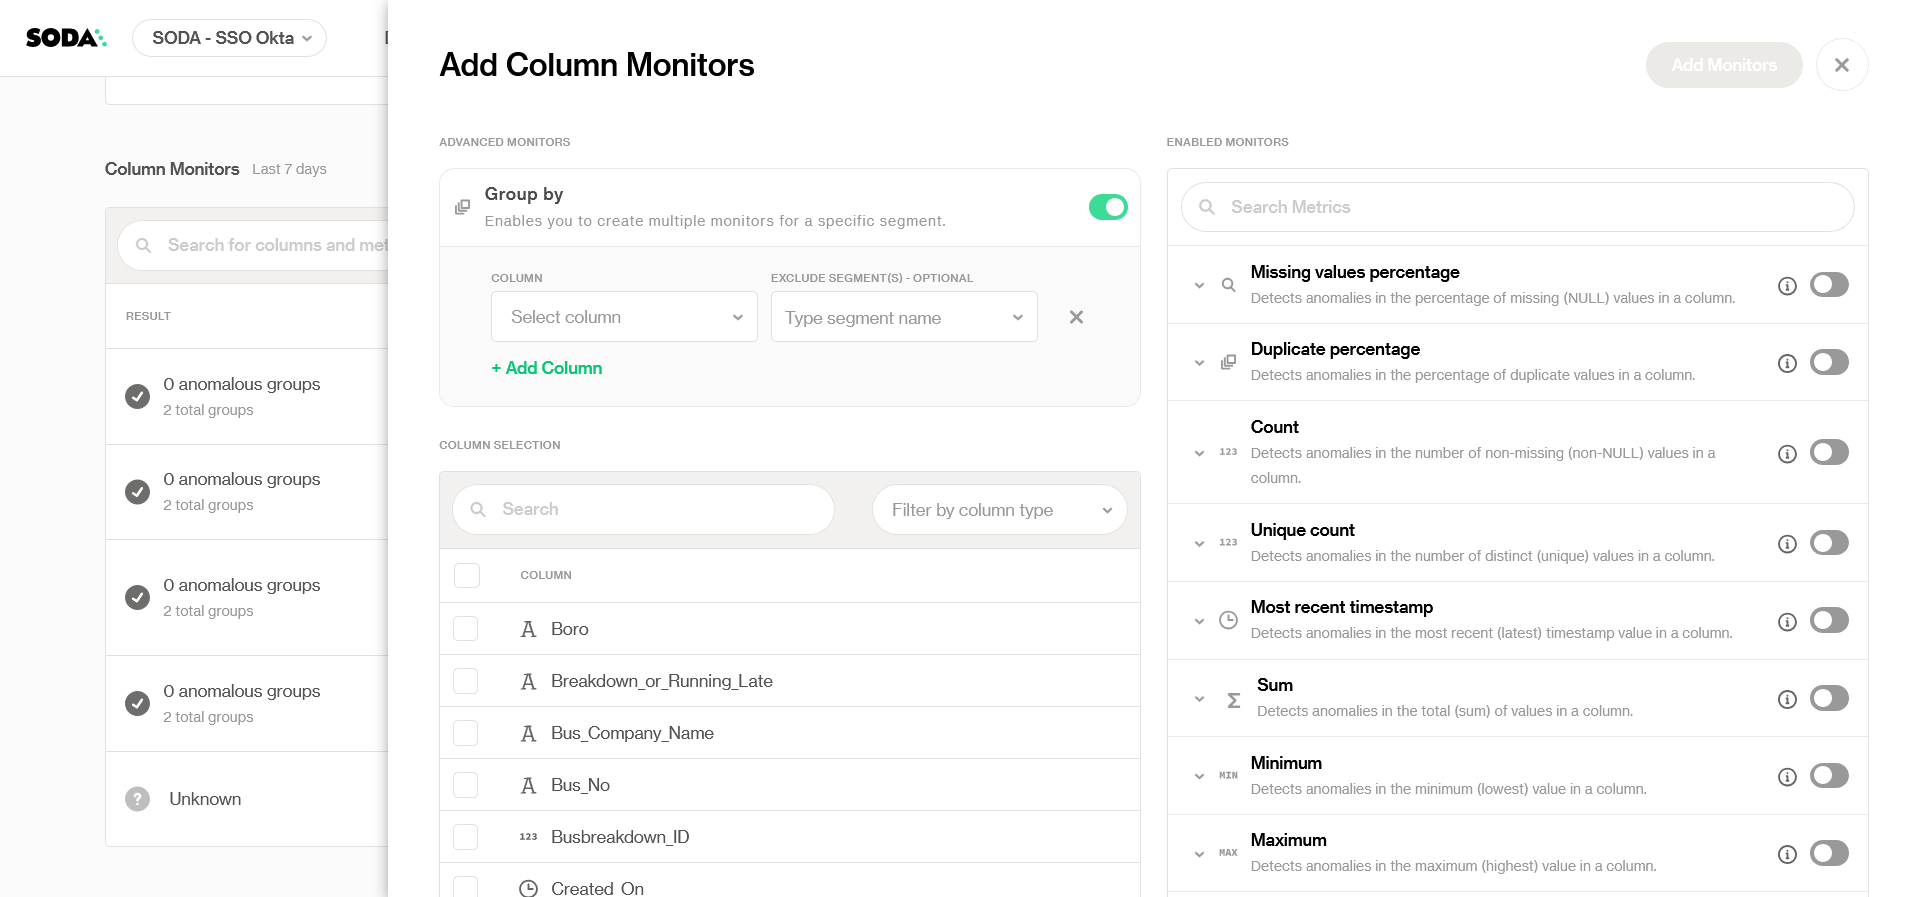
1. Scroll to the **Column Monitors table** and click **Add Column Monitors**.
2. In the **Add Column Monitors** panel, toggle on **Group By**.
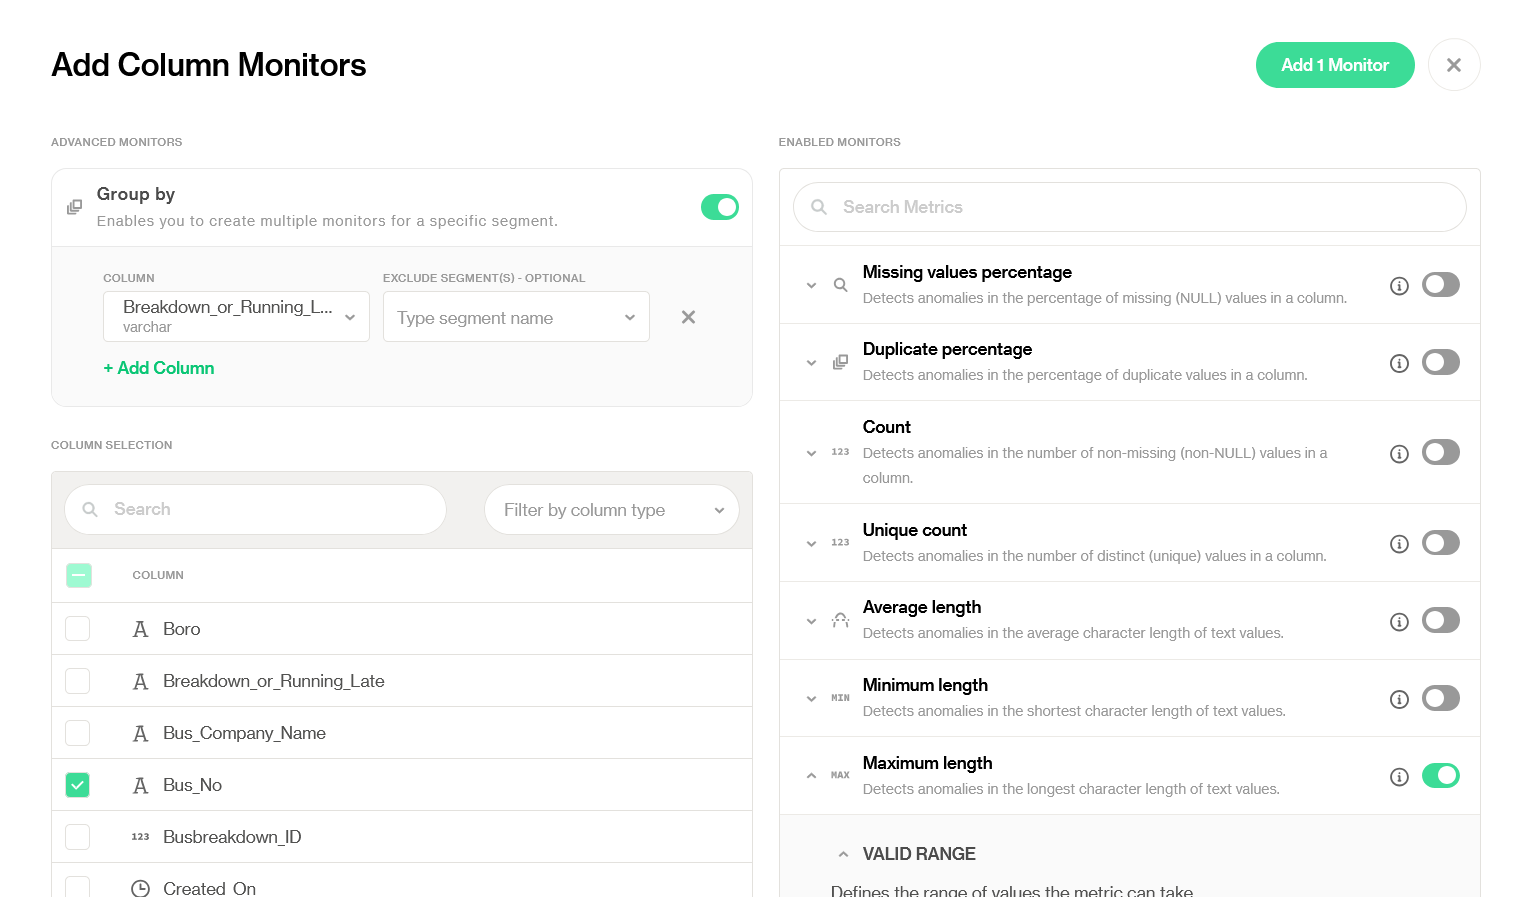
3. Select one or more columns to group by.
{% hint style="warning" %}
For the time being, only columns with a maximum of **50 distinct categories** are eligible for Group By monitoring.
{% endhint %}
{% hint style="info" %}
Multiple columns can be selected, but note that the resulting categories are **combinatory** (e.g., `Column A × Column B`).
{% endhint %}
4. (Optional) **Exclude specific categories (segments)** that you don’t want to monitor.
5. Select one or more columns to monitor under **Column Selection**.
6. Enable one (or more) metric from the right-hand list.
7. Click **Add 1 Monitor** on the top right to save.
The monitor now appears in the **Column Monitors table** and starts tracking anomalies across each category.
### Category management
* Categories can be excluded when configuring the monitor. See Step 4 on [#add-group-by-monitors](#add-group-by-monitors "mention").
* Categories can be deleted after creation from the [#groups-table](#groups-table "mention") if you decide they should no longer be monitored.
***
## Key Considerations
* **One Group By monitor at a time**\
Only one configuration is allowed, since Group By monitors expand into many underlying monitors.
* **Multiple Group By columns**\
More than one column can be selected, but the categories generated are combinatory.
* **Category limits**\
Columns with more than 50 categories cannot be used for Group By monitoring.
* **Exclusions and deletions**\
You can exclude categories at configuration time or delete them later from the [#groups-table](#groups-table "mention").
* **Notifications**\
Notifications are configured at the **column level**, not yet at the per-category level.
***
With Group By monitors, you gain more granular visibility into your data quality, while keeping control over compute cost and category management.
***
{% hint style="info" %}
You are **not logged in to Soda** and are viewing the default public documentation. Learn more about [Licensing & documentation access](/soda-documentation/reference/documentation-access-and-licensing.md).
{% endhint %}
---
# Agent Instructions
This documentation is published with GitBook. GitBook is the documentation platform designed so that both humans and AI agents can read, navigate, and reason over technical content effectively. Learn more at gitbook.com.
## Querying This Documentation
If you need additional information that is not directly available in this page, you can query the documentation by asking a question.
Perform an HTTP GET request on the following URL with the `ask` and `goal` query parameters:
```
GET https://docs.soda.io/soda-documentation/data-observability/metric-monitoring-dashboard/group-by-monitors.md?ask=&goal=
```
`ask` is the immediate question: it should be specific, self-contained, and written in natural language.
`goal` is what the user is ultimately trying to achieve, the reason they need the answer. Sharing it helps GitBook give you a better, more relevant answer. A goal is most helpful when it describes the outcome the user wants rather than restating the question. For example, with `ask=how do I create an API token`, a goal like `automate deployments from our CI pipeline` lets GitBook tailor the answer to that use case.
The response will contain a direct answer to the question and relevant excerpts and sources from the documentation.
Use this mechanism when the answer is not explicitly present in the current page, you need clarification or additional context, or you want to retrieve related documentation sections.